1. Introduction
Wheat is the second staple food in Korea and its consumption has been continuously increasing as consumers’ life patterns are becoming more westernized and diversified. The per-capita annual consumption of wheat has increased from 14 kg in the 1970s to 36 kg in 2022, whereas that of rice decreased from 136 kg to 57 kg (Statistics Korea, 2023). The self-sufficiency rate of Korean domestic wheat in 2023 was reported to be 2.0% (MAFRA, 2024) and most of wheat processed products in Korea still depend on imported foreign wheat (Kim, 2017). However, a constant increase in the production of Korean domestic wheat is expected owing to the recent efforts aimed at enhancing the self-sufficiency rate. Therefore, it is necessary to explore ways of utilizing Korean wheat in food processing and thus contribute to enhance its consumption.
Compared to white wheat flour, which is produced by a milling process with minimal inclusion of wheat bran, whole wheat flour is highly nutritious because it contains wheat bran which includes dietary fibers, minerals, vitamins, and antioxidants (Wang et al., 2016). As consumers become aware of the health benefits of intaking whole grain foods such as reducing the risks of hypertension, obesity, type 2 diabetes, and colon cancer, a constant demand for whole wheat products has been maintained (Cai et al., 2014).
Whole wheat flour is generally produced by grinding the whole grain kernel or blending bran and the corresponding white wheat flour in a proportion at which they were initially milled (Cai et al., 2014). In Korea, whole wheat flour is categorized into “Others” when determining the wheat flour grade which depends on the ash content. Wheat flour with an ash content below 2.0% is classified into “Others” and put higher value on special functionality than processability (MFDS, 2021). Meanwhile, the clear definition and specific criteria have not been established for the usage and processability of Korean whole wheat flour, in contrast to Korean white flour which is classified into strong, medium, and soft flour according to the protein content for its processability and end-use. To identify factors for classifying and processing whole wheat flour, it is necessary to investigate its quality characteristics and processing properties which are expected to be different depending on its milling method, extraction yield, and wheat bran proportion.
The inclusion of wheat bran in flour was reported to give negative effects on dough formation and bread-making by disrupting gluten network development and decreasing gas-holding capacity (Cai et al., 2014). The presence of wheat bran increased water absorption and crumb firmness, and decreased viscosity and bread volume for Brazilian wheat (Schmiele et al., 2012). The addition of wheat bran, especially at contents greater than 10%, degraded dough rheological properties and French bread-making qualities (Le Bleis et al., 2015). Some studies have suggested that the maximum addition levels of wheat bran for bread-making as 20% (Sidhu et al, 1999), and 30% (Haridas Rao and Malini Rao, 1991). The proportion of the added wheat bran varies in Korean whole wheat flour which does not have specific criteria for production and processing (Kwak et al., 2017). However, little is known about Korean whole wheat flour while it is necessary to investigate quality characteristics and processing properties according to different bran addition levels and production types.
The objective of this study was to determine quality characteristics of Korean whole wheat flour produced by the partial addition of wheat bran and identify influencing factors on processing, especially on the bread-making. For this purpose, Korean whole wheat flour samples with different ratios of wheat bran were prepared to represent various production types of whole wheat flour. Quality characteristics including nutritional constituents and processing properties such as pasting, dough, and bread-making quality were determined to find factors for the classification and processing of Korean whole wheat flour.
2. Materials and methods
Whole wheat grains of two representative Korean hard wheat varieties (Baekkang and Hwang-geum-al) harvested in 2023 were provided by Gyeongbuk Agricultural Research & Extension Services (GBARES) field crop research team.
Wheat grains were tempered overnight to a 15% moisture level and milled using a Bühler experimental mill (MLU 202, Bühler, Uzwill, Switzerland). Flours from three break rolls and three reduction rolls were collected for each wheat sample, and straight-grade flour (white flour) was prepared by recombining the flours from the six streams. Bran and shorts fractions were collected separately for each sample. The cleaned bran fraction was further ground with a centrifugal mill (ZM 200, Retsch Gmbh, Germany) equipped with a 0.5mm screen. To prepare wheat flour samples with different percentages of bran, the bran fraction samples were added to each corresponding white flour at 0% (Br0), 5% (Br5), 10% (Br10), 15% (Br15), and 20% (Br20) levels, and whole grain wheat flour (WGWF) samples were prepared by combining the corresponding white flour, ground bran, and shorts fractions in a proportion at which they had been initially milled.
Moisture, protein and ash content of flour were measured according to AACC methods 44-15A, 46-30, and 08-01 (AACC International, 2009). Flour color (lightness, redness, and yellowness) was determined using a colorimeter (CR-5, Minolta, Osaka, Japan) and expressed in the CLE-LAB trichromatic system as L*, a*, and b* values. To determine gluten strength of the flour, sodium dodecyl sulfate (SDS) sedimentation test was performed according to AACC method 56-70 (AACC International, 2009) and a sedimentation volume was measured after 20, 40, and 60 min. Particle distribution of each flour sample was measured using particle size analyzer (MS 2000, Malvern Instruments, Malvern, UK).
Total dietary fiber (TDF) contents of the flour samples were determined according to AOAC method 985.29 (AOAC International, 2007) which corresponds AACC method 32-05 (AACC International, 2009) using Megazyme kit (Megazyme International Ireland Ltd.). Total arabinoxylan (TOAX) contents were determined using the colorimetric method developed by Douglas (1981) which measures the pentose sugar content in wheat flour. Total phenolic compounds (TPC) were determined using the Folin-Ciocalteu method (Folin and Ciocalteu, 1927).
Dough properties were evaluated using a mixograph (National Mfg. Co., Lincoln, NE, USA) in accordance with AACC method 54-40 (AACC International, 2009). Flour sample (10 g, 14% moisture content base) was mixed with water in a mixograph bowl for 10 min, and the corresponding mixogram was obtained using MIXSMART software. Water absorption (WA), dough development time (MPT), midline peak value (MPV), midline time x=8 min value (MTxV), and curve tail integral (CTI) were determined.
Pasting properties of flour sample were analyzed using a Rapid Visco Analyzer (RVA 4, Newport Scientific, Sydney, Australia). Three and a half grams of a flour sample and 25 mL of distilled water were prepared in an RVA canister. The obtained mixture was gently agitated with an RVA paddle to disperse the flour lumps, and the RVA canister was subjected to a 13 min RVA test with Standard 1 profile. The resulting RVA curve was used to obtain the following characteristics: peak viscosity (PV), trough viscosity (TV), breakdown viscosity (BD), final viscosity (FV), setback viscosity (SB), pasting temperature, and peak time.
To determine bread-making properties, AACC method 10-10B (AACC International, 2009) was used with slight modifications. The formula contained 250 g (14% moisture basis) of flour, 3 g of dry yeast, 15 g of sugar, 4.5 g of salt, 10 g of shortening, and 5 g of nonfat dry milk. All ingredients were mixed with water estimated from the mixograph. The produced dough was fermented for 60 min in a fermentation room at 27°C and relative humidity of 75%. One hundred and thirty grams of three dough pieces were each rounded and proofed at room temperature (25°C) for 15 min. Each dough piece was placed on 13.0×5.5×4.5 cm pan, proofed for 30 min, and baked at 170°C/180°C for 20 min in a convection oven. All bread samples were cooled at room temperature (25°C) for one hour before evaluating bread-making properties.
The weight and height of each bread sample were measured using a scale and calipers, respectively. Bread loaf volume was measured through rapeseed displacement according to AACC method 10-05.01 (AACC International, 2009). The specific volume of the bread was calculated using bread loaf volume and weight. The rheological properties of bread crumb were analyzed by conducting a two-bite compression test using a rheometer (Compac-100, Sun Scientific Co., Tokyo, Japan), and hardness, springiness, cohesiveness, chewiness, and brittleness were determined. The color characteristics of bread crumb were evaluated using a colorimeter (CR-5, Minolta, Osaka, Japan).
Statistical analysis was performed using IBM SPSS statistics software (ver. 17.0, SPSS Inc., Chicago, IL, USA). To compare the differences among different production types of Korean whole wheat flour for each Korean wheat cultivar, one-way analysis of variance (ANOVA) test and Duncan’s multiple range test were performed. Correlations between two variables were assessed by performing Pearson’s correlation test. Principal component analysis (PCA) was conducted to explore important factors for processing Korean whole wheat flour. P-values less than 0.05 were considered to be statistically significant.
3. Results and discussion
There were concentration-dependent differences among the wheat flour samples in ash, protein, and color characteristics (Table 1). In Korea, ash content is used as the main criterion for determining flour grade: Grade 1 (<0.6%), Grade 2 (<0.9%), Grade 3 (<1.6 %), and Others (<2.0%) (MFDS, 2021). According to this criterion, most Korean whole wheat flour products are categorized as “Others”, without additional classification sub-criteria.
In this study, ash content was well divided into six categories by different addition levels of wheat bran regardless of cultivar; Br0 (white flour): less than 0.5%, Br5: 0.5-0.7%. Br10: 0.7-1.0%, Br15: 1.0-1.2%, Br20: 1.2-1.4%, and WGWF: more than 1.4% (Table 2). These were determined based on the ash contents of the differently produced wheat flour samples (Br0-20, WGWF) of four representative Korean wheat cultivars; Baekkang and Hwang-geum-al for bread-making (reported in this study), and Saegeumgang and Geumgang which are medium wheat cultivars for noodle-making (data not shown).
Range for classification was based on ash contents of four representative Korean domestic wheat cultivars (Baekkang, Hwang-geum-al, Saegeumgang, and Geumgang).
Korean flour grade is rated by ash content (%): Grade 1, <0.6; Grade 2, <0.9; Grade 3, <1.6; Others, <2.0 (MFDS, 2021).
French flour type is classified by ash content (%): T45, <0.5; T55, 0.5-0.6; T65, 0.62-0.75; T80, 0.75-0.9; T110, 1.0-1.2%, T150, ≥1.4% (Calvel et al., 2013).
In Europe, flour is categorized based on the ash content. For example, French flour is graded by a T(type)-system according to its ash content defined in the French Decree; T45: less than 0.5%, T55: 0.5-0.6%, T65: 0.62-0.75%, T80: 0.75-0.9%, T110: 1.0-1.2%, and T150: more than 1.4% (Calvel et al., 2013). This categorized T-system cannot determine the exact usage of flour, but it has been used for a long time to select a particular application, for example, T45 for pastries, T55 for white bread, and T65-150 for various types of brown bread. Similarly, the categories divided by the ash content in this study could be used as classification criteria and usage suggestions for Korean wheat flour.
In Korea, several old-fashioned flour mills produce white flour containing a certain percentage of wheat bran (Moon et al., 2018). Therefore, there is a perception that Korean domestic white flour is of poor quality and lacks processability, similar to whole wheat flour. It is important to not only improve the flour mill and milling skill of small-scale mills, but also find practical ways to utilize Korean domestic flour produced in the current situation. If the flour with certain percentage of wheat bran could be categorized into one of the whole wheat flour types based on these criteria, the application range could be expanded and the perception of Korean wheat flour would be improved.
Protein content increased significantly with increasing bran addition level (Table 1). It is an important index for classifying the usage of white flour; higher protein content of white flour (more than 12%) is considered as having better abilities of gluten formation and bread-making. White flour is mostly composed of endosperm part, and its protein primarily consists of gluten protein (more than 80%). However, whole wheat flour contains other parts of wheat such as bran and germ which consist of non-gluten proteins (including albumin and globulin). Hence, higher protein content of whole wheat flour does not necessarilly indicate higher gluten protein content, as the amount of gluten is diluted by other proteins (Schmiele et al., 2012). In this study, the increased protein contents in the wheat flour samples with higher bran proportions may be derived from the non-gluten proteins of wheat bran. And the decreasing tendency of SDS sedimentation value from Br0 to WGWF also demonstrates the dilution of gluten protein, resulting in lower gluten strength of flour with the addition of wheat bran.
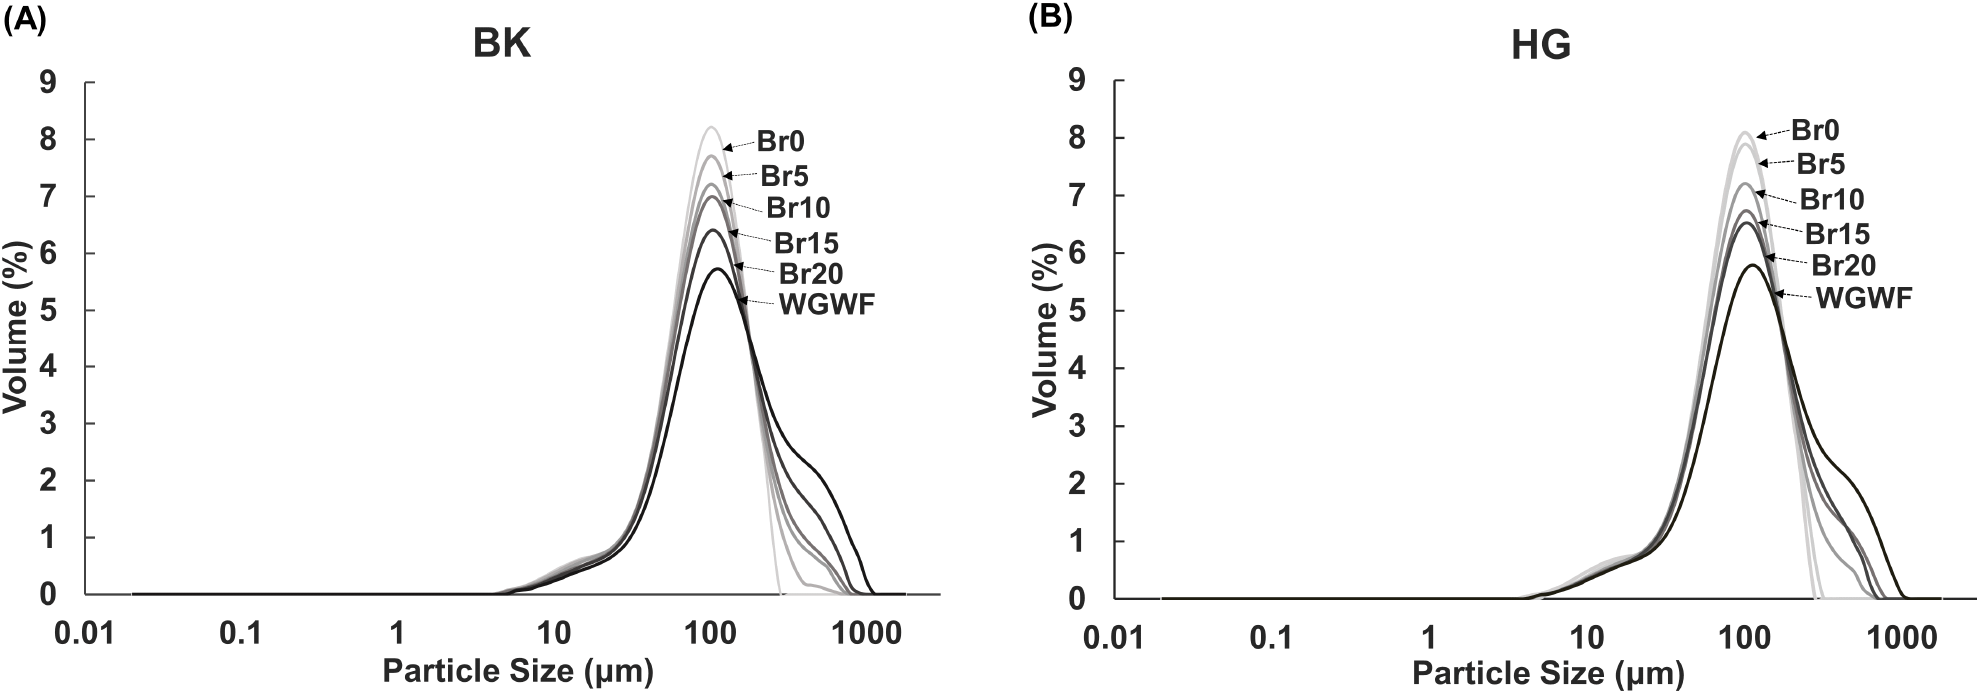
Particle size became larger as bran addition level increased and approached to WGWF (Fig. 1). The particle size of whole wheat flour is considered an important factor affecting the flour functionality and quality of final products including bread (Bressiani et al., 2019; Lin et al., 2020). In this study, because wheat bran was ground and sieved in the same way, resulting in the same particle size of wheat bran for each cultivar, the differences in particle size among the flour samples can be attributed to the different degrees of bran inclusion. This was confirmed by the strong correlation (r=0.89, p<0.05) between ash content and particle size (d90). Further research should be conducted to explore flour characteristics and processing properties at various wheat bran particle size.
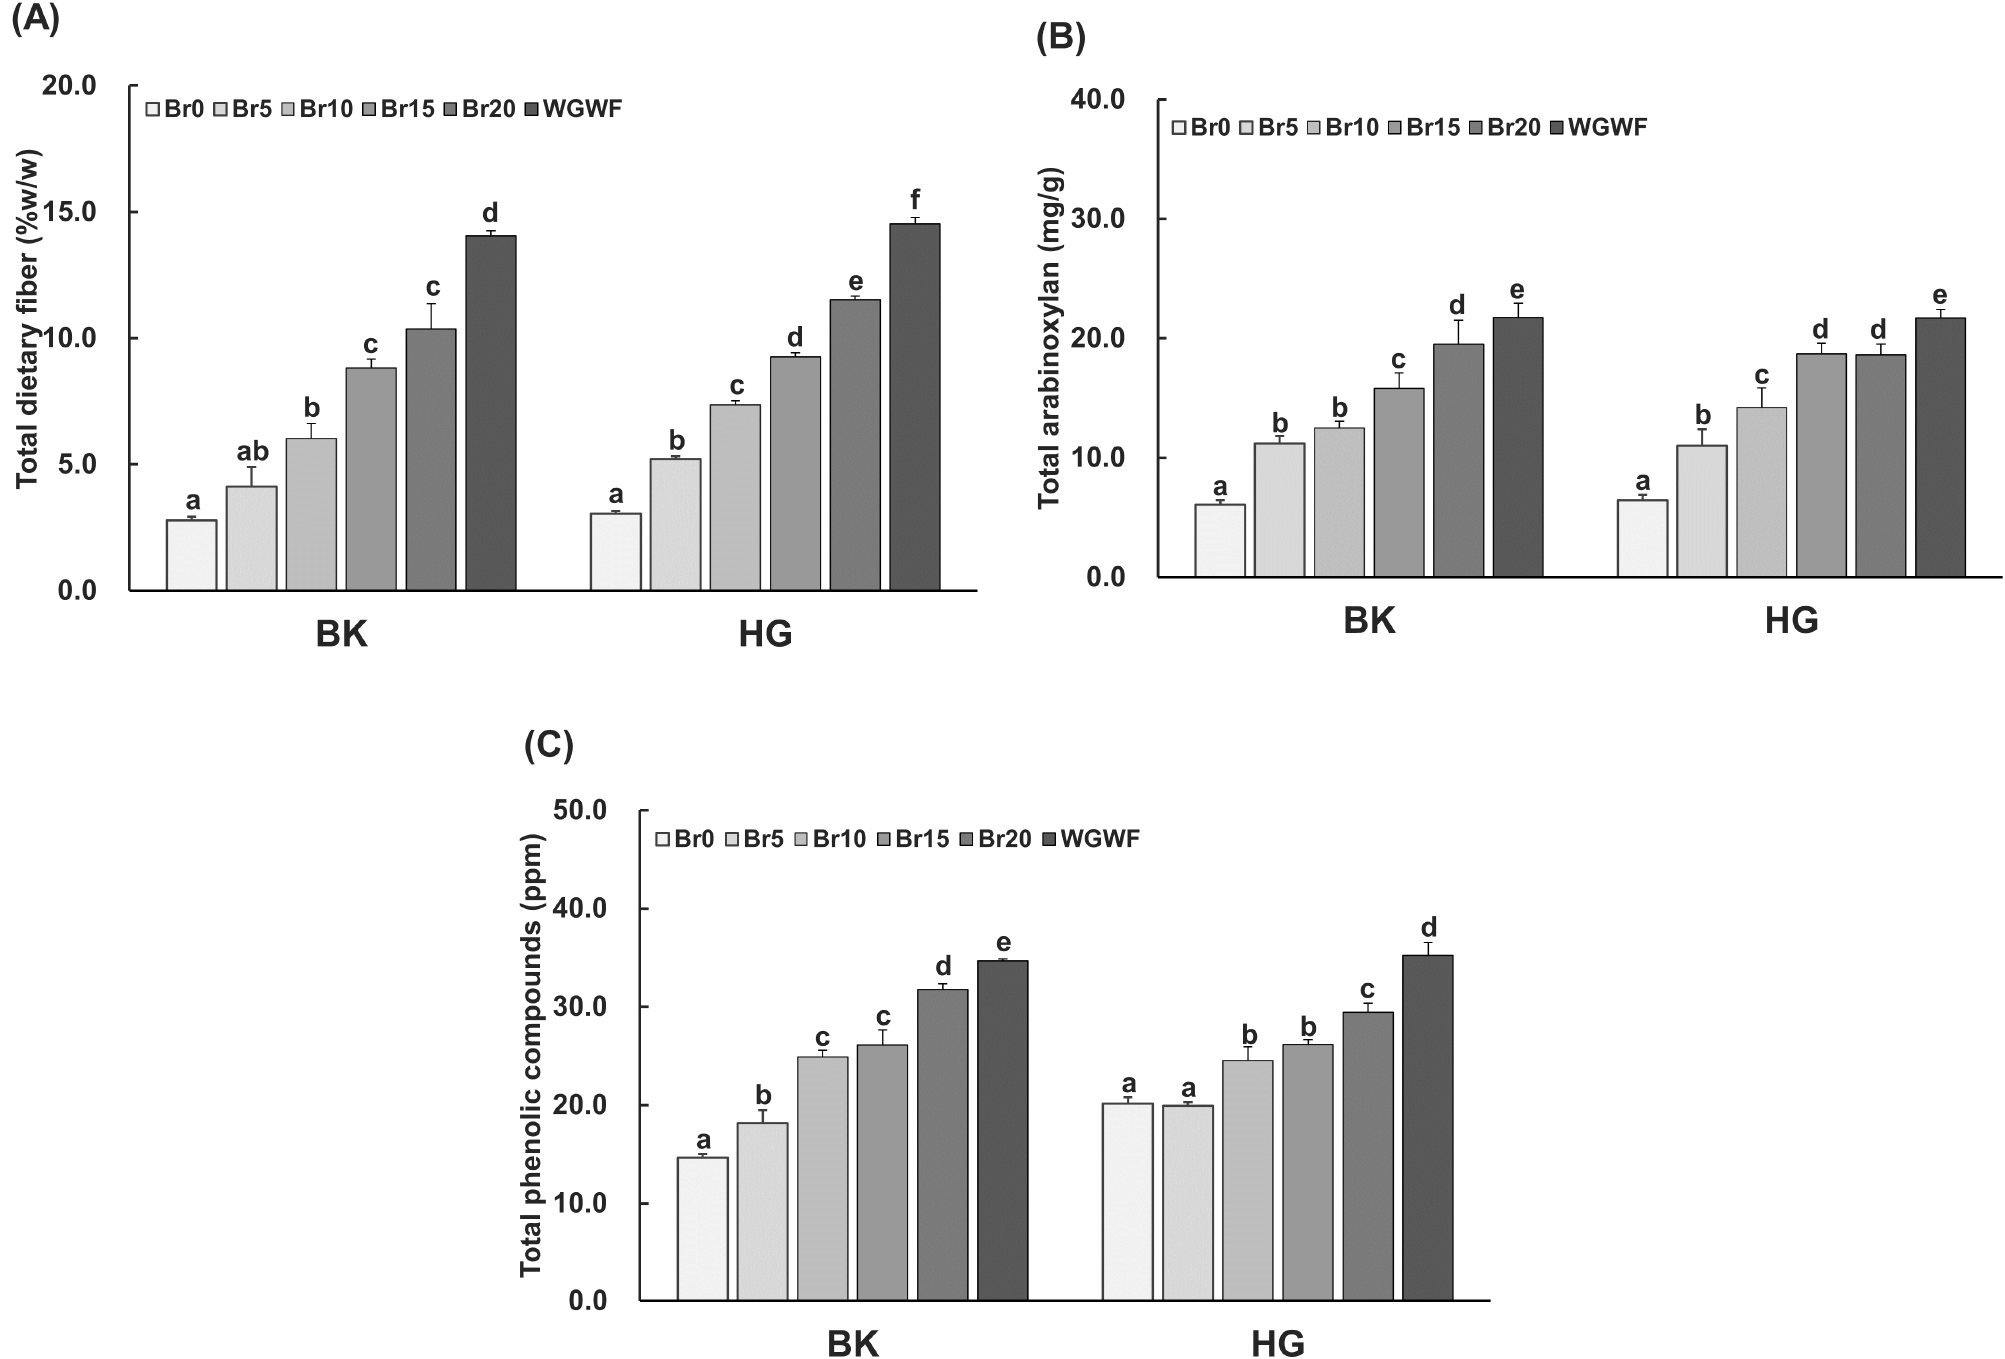
Wheat bran is rich in fiber, minerals, pyridoxine (vitamin B6), thiamine (vitamin B1), folate (vitamin B9), tocopherol (vitamin E), and some phytochemicals, such as phenolic compounds (Shewry, 2009). Most beneficial antioxidant phytochemicals in whole wheat grains are present in the germ and bran fractions (Stevenson et al., 2012). Arabinoxylan (AX), a major non-starch polysaccharides in wheat and important source of antioxidant phenolic compounds including ferulic acid, primarily originates from bran and starchy endosperm (Chen et al., 2019). Therefore, wheat flour containing a certain amount of bran and whole grain wheat flour are expected to have a higher nutritional value than refined white flour. In this study, as wheat flour contained higher percentage of bran, the levels of nutritional constituents, such as TDF, TOAX, and TPC, significantly increased, confirming the nutri-functional value in Korean whole wheat flour (Fig. 2). However, it is also reported that the presence of AX, especially water-unextractable AX, exerts a detrimental effect on dough and bread quality, disrupting the dough structure and interfering with the gluten network formation (Nishitsuji et al., 2020). The processing properties of the flour samples were analyzed to identify the effects of bran addition on dough and bread quality.
Mixograph is used to evaluate the dough and gluten properties of wheat flour by measuring the resistance of a dough to mixing (Shumate, 2020). By using mixograph parameters, such as WA, MPT, MPV, MTxV, and CTI, the processing properties of wheat flour for bread-making can be predicted.
WA demonstrated an increasing trend as the bran addition level increased and approached to WGWF (Table 3), which is consistent with the previous study that water absorption increased with an increase in the protein content, fiber incorporation, and damaged starch addition (Goldstein et al., 2010). MPT and MPV showed decreasing tendency with increasing bran fraction in BK cultivar. The incorporation of bran into dough system may damage the gluten structure and result in short development time and weak dough strength (Bae et al., 2014); hence, the shorter MPT and lower MPV by adding bran are inferred to deteriorate dough properties by forming weaker and less viscous dough. MTxV is used to express the stability of dough and CTI describes the energy required during the dough mixing process (Li et al., 2023). MTxV and CTI of flour samples in this study were highest for Br0 and lowest for WGWF. The values among Br5-20 samples were not significantly different but exhibited decreasing trend for BK cultivar. This implies that WGWF which includes higher proportion of by-product fractions of wheat grain exhibits weaker dough stability and requires less energy for dough mixing, which can be different according to cultivar.
Based on the mixograph results, it can be inferred that Korean hard wheat flour with higher percentage of bran would possess less-sufficient dough strength, stability, and development time, which is confirmed by the significant correlations between dough properties and flour quality parameters related to wheat bran addition: MPV with ash (r=−0.58, p<0.05), MTxV with TDF (r=−0.63, p<0.05), and MPT with protein (r=−0.63, p<0.05).
RVA has been used to determine the pasting properties of flour, providing information on its gelatinization and retrogradation characteristics (Zhou et al., 2012). RVA pasting properties are mainly influenced by the starch amylose content and other factors such as protein, amylase, and lipid. Particle size distribution can also affect the pasting properties of wheat flour (Frauenlob et al., 2017).
PV occurs with the maximum swelling of starch granules. In this study, Br0 flour sample which is identical to white flour had the highest PV, and flour samples with higher proportion of bran had lower PV and WGWF exhibited the lowest value (Fig. 3). This can be explained that the presence of fibers, which is the main component of wheat bran, brought about dilution of the flour starch, inhibiting water absorption and swelling of starch granules during gelatinization (Wang et al., 2022).
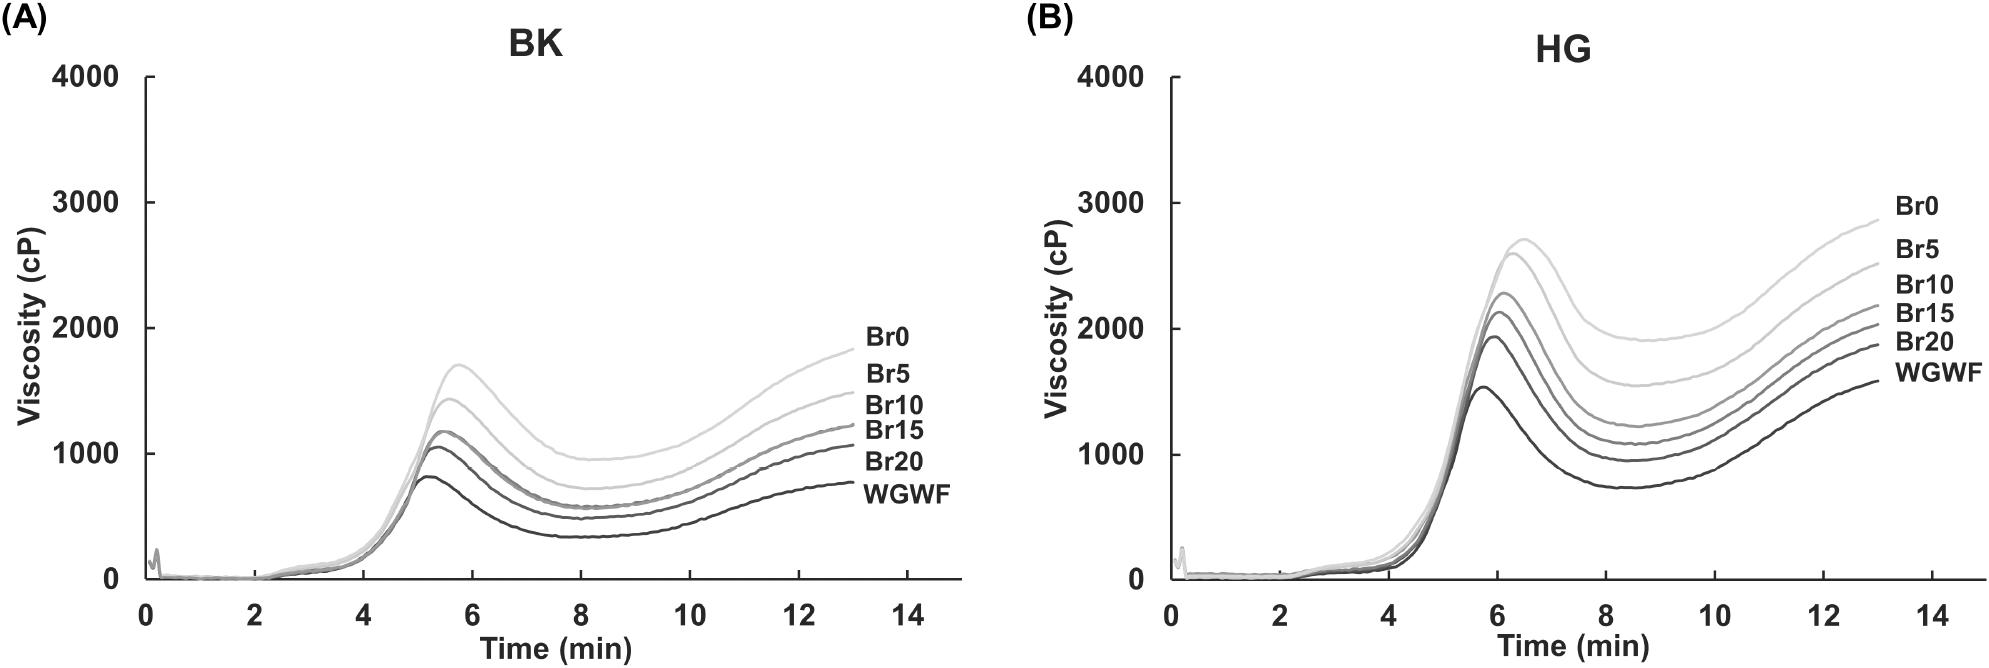
A similar pattern was observed for other pasting parameters. BD, which is defined by subtracting TV from PV, is considered as a measure of the degree of disintegration of granules or paste stability (Tsakama et al., 2010) and the ability of starches to withstand heating at high temperature and shear stress (Ragaee et al., 2006). The decreasing trend in BD observed from Br0 to WGWF in the flour samples implies a lower stability to heat and mechanical shear of starches owing to inclusion of wheat bran. SB, which is defined by subtracting TV from FV, is commonly related to retrogradation and reordering of starch molecules during cooling period of RVA test (Nakamura et al., 2016). Some researchers have reported the incorporation of fibers into wheat flour increases starch retrogradation and bread staling (Katina et al., 2006; Santos et al., 2008). However, in this study, the SB value decreased as bran addition level increased and approached to WGWF, which can predict delayed of starch retrogradation and bread staling. Similar RVA results have been reported with the addition of other ingredients or by-products to wheat flour (Chen et al., 2011; Lee, 2003). These contrary results may be ascribed to bran characteristics such as particle size and cultivar type (Cai et al., 2014) and measurement methods to examine starch retrogradation. To investigate the effect of bran addition to the flour on starch retrogradation, additional studies such as preservation tests of the wheat processed food products at different storage period are required.
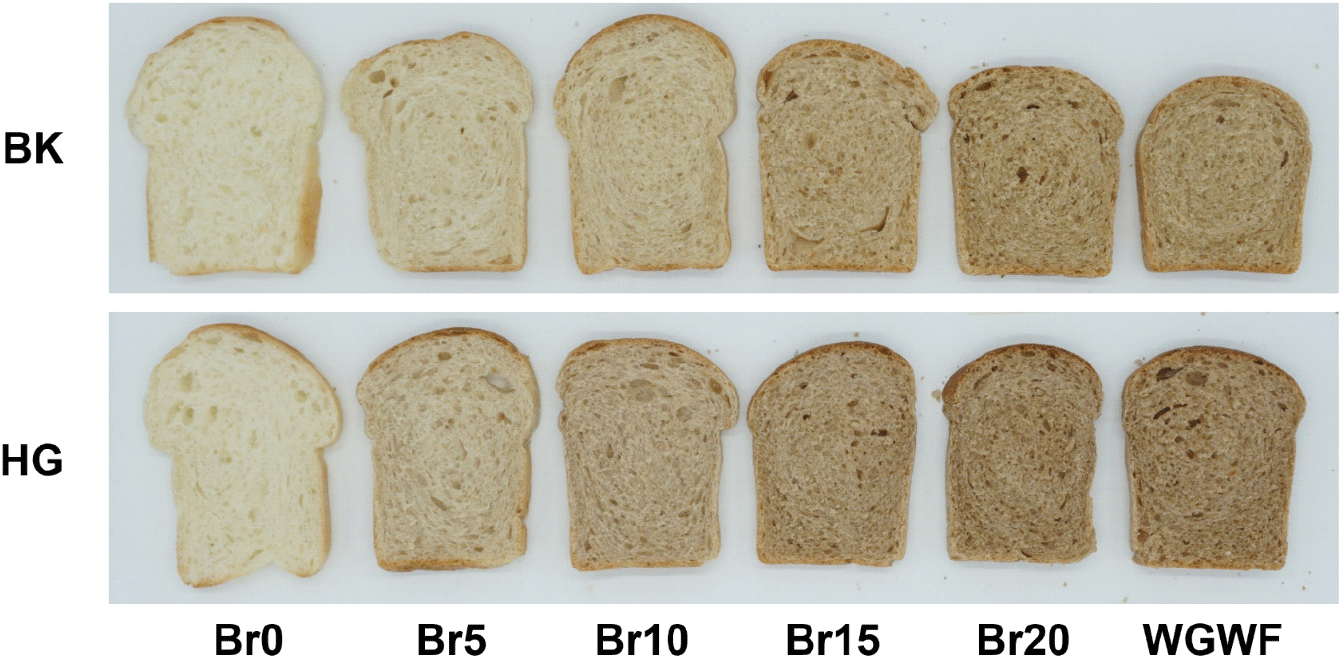
There were significant differences in bread appearance parameters among the samples regardless of cultivar (Fig. 4). Bread loaf volume, specific volume, and height demonstrated downward trends with increasing bran level (Table 4). Bread specific volume is affected by various factors such as protein content and quality, as well as other grain and flour characteristics (Li et al., 2023). The lower bread loaf volume observed by adding bran can be ascribed to two factors: the physical disruption of the dough foam structure during fermentation by minimizing gas retention (Xu et al, 2018) and change of water distribution in dough by competing with gluten protein which plays a significant role in maintaining the proofed dough volume (Bock, 2019).
Bread crumb texture is another important parameter which affects consumers’ preference, and the rheological properties of bread crumb showed differences among the samples in this study. In particular, hardness, chewiness, and brittleness of bread crumb demonstrated uptrends with increasing bran content (Table 4). Wheat bran with high fiber content may increase the degree of crumb firmness in bread by competing for water with starch molecules (Katina et al., 2006). In general, hardness, gumminess, and chewiness of bread crumb are negatively correlated with bread quality and the bread with higher specific volume exhibits lower hardness in crumb (Wang et al., 2017; Zeng et al., 2023). It is speculated that wheat flour with higher bran and fiber contents resulted in poor bread quality by having lower loaf volume and denser crumb texture with more compact and coarse structure.
Bread crumb color is a critical quality parameter in bread-making and consumers’ choice. As expected, significantly lower lightness (L*) and higher redness (a*) and yellowness (b*) were observed for bread crumb with a higher wheat bran content (Table 4). Compared between cultivars, HG had a darker bread crumb color in the flour samples with added bran (Fig. 4), which is ascribed to the differences in the color of wheat bran according to cultivar. A dark bread crust color can be negatively perceived as the occurance of an excessive browning reaction during bread-baking process (Zeng et al., 2023), but a dark bread crumb color can have positive influence on consumers who consider a darker whole wheat bread nutritious and healthy, which is also consistent with the nutritional constituent levels in this study.
Considering bread loaf specific volume and bread crumb texture such as hardness, chewiness, and brittleness, Br5-10 in BK cultivar and Br5 in HG cultivar exhibited as satisfactory bread quality as that of the white flour samples (Br0) which are assumed to possess good bread-making properties by having few hindrance factors such as wheat bran. To clarify the optimum bran addition level of Korean hard wheat flour that satisfies the desired bread-making properties and nutritional benefits, consumer sensory analysis should be conducted in further developments.
Correlations between bread qualities and flour, pasting, and dough characteristics are presented in Table 5. Bread specific volume was highly and negatively correlated with ash contents (r=−0.91, p<0.01), suggesting that the flour with higher added bran and by-products would have lower bread specific volume. Meanwhile, the rheological properties of bread had significantly positive correlations with ash contents, hardness (r=0.81, p<0.01), chewiness (r=0.89, p<0.01), and brittleness (r=0.88, p<0.01), which also represents the bread would have lower bread quality indicating a harder and denser texture with increasing bran addition level.
PSd90, particle size d90; TDF, total dietary fiber; TOAX, total arabinoxylan; TPC, total phenolic compounds; PV, peak viscosity; TV, trough viscosity; BD, breakdown viscosity; FV, final viscosity; SB, setback viscosity; WA, water absorption; MPT, midline peak time; MPV, midline peak value; MTxV, midline time x=8 min value; CTI, curve tail integral.
Pasting properties were significantly and positively correlated with bread height (PV; r=0.61, p<0.05) and bread specific volume (FV; r=0.69, p<0.05), however, they had significantly negative correlations with the bread rheological properties: hardness (PV; r=−0.82, p<0.01), chewiness (FV; r=−0.78, p<0.01), and brittleness (SB; r=−0.74, p<0.01). Springiness, which was reported to have strong correlation with PV, BD, and SB in noodles (Hormdok and Noomhorm, 2007), demonstrated weak correlations with bread quality parameters in this study. RVA can provide important information on flours for noodle-making and some pasting parameters have close correlations with the noodle quality (Chen et al., 2011; Zhang et al., 2005). The results of the correlation analysis between pasting parameters and bread-making properties in this study suggest that pasting parameters would also be useful for predicting bread loaf quality and crumb texture such as hardness, chewiness, and brittleness.
Among parameters of dough properties, MTxV and CTI strongly and negatively correlated with rheological properties of bread such as hardness (MTxV; r=−0.84, p<0.01), chewiness (CTI; r=−0.79, p<0.01), and brittleness (MTxV; r=−0.76, p<0.01), and exhibited positive correlations with bread specific volume (MTxV; r=0.77, p<0.01, CTI; r=0.81, p<0.05). The whole wheat flour with low dough stability and dough mixing energy would possess a hard and dense bread crumb texture along with a low bread specific volume, and these parameters can be used for predicting bread quality.
Bread specific volume also exhibited negative correlations with particle size (d90) (r=−0.87, p<0.01), TDF (r=−0.91, p<0.01), TOAX (r=−0.91, p<0.01), and TPC (r=−0.89, r<0.01) of flour, and some of the bread crumb texture parameters had positive correlations with TDF (hardness; r=0.72, p<0.01), TOAX (chewiness; r=0.92, p<0.01), and TPC (brittleness; r=0.86, p<0.01). Based on these results, it is expected that the bread prepared from Korean whole wheat flour with a higher bran content would also have a higher nutritional value. However, the effect of the bread-making process on the nutritional constituents of the bread should be examined in more detail.
To summarize the obtained data and identify major factors influencing the bread-making properties of whole wheat flour samples, a principal component analysis (PCA) was conducted, and its loading plot is presented in Fig. 5. The first two PCA components explain 85.4% of the total variation: component 1 (PC1) accounted for 52.8% and component 2 (PC2) accounted for 32.6%. The factors that are closely located in the PCA plot have positive correlations and factors that are diagonally located on the opposite sides have negative correlations. Bread specific volume and bread height were positively correlated with pasting parameters (PV, TV, SB and FV) and dough stability (MTxV), but negatively correlated with ash contents and nutritional constituents of flour. Bread hardness, chewiness, and brittleness were negatively correlated with pasting parameters and SDS 20 min value, indicating that lower pasting viscosities and gluten strength of Korean whole wheat flour would result in an inferior bread crumb texture.
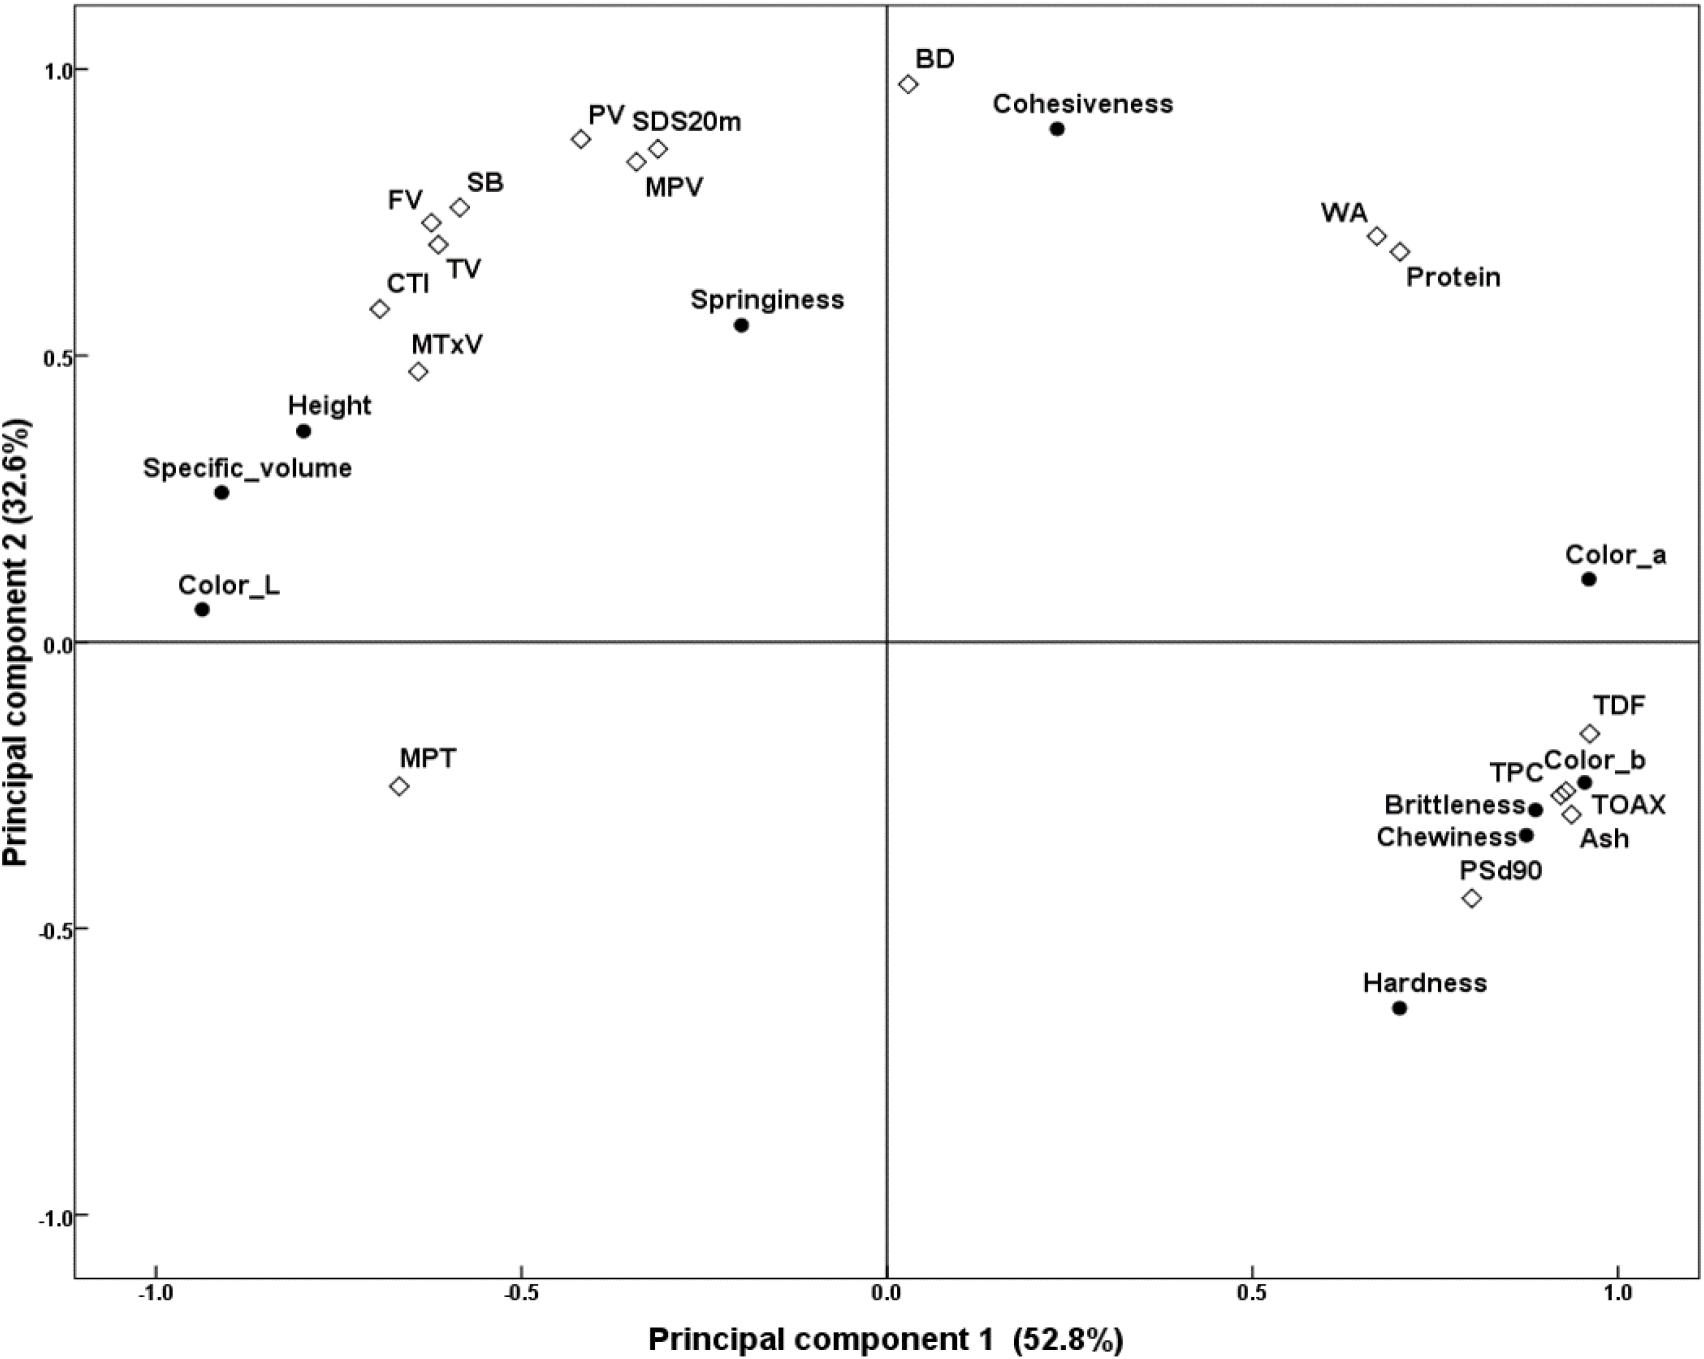
Combining the results of correlation and PCA analysis, it can be concluded that pasting parameters, dough stability, gluten strength, and ash contents are closely related to the bread quality parameters, suggesting that these characteristics would be utilized as important and useful factors for predicting the quality of bread prepared from Korean hard whole wheat flour. Particle size of whole wheat flour which also has close relationships with bread qualities should be further studied by varying particle size of bran and milling methods. Finally, nutritional constituents can be utilized to verify the nutritional value of Korean whole wheat flour.
4. Conclusions
Whole wheat flour samples with different Korean hard wheat cultivars and bran addition levels were produced in this study to represent various types of Korean whole wheat flour and determine the key factors for categorization and processability by analyzing quality characteristics and bread-making properties. The flour samples were well-divided into six categories based on their ash contents, which could be used as classification criteria and usage suggestions. The amounts of the nutritional constituents significantly increased as the bran addition level increased and approached to WGWF. However, the addition of wheat bran negatively affected the main parameters of dough and pasting properties, presenting weaker dough strength and stability and lower starch gelatinization ability. Bread loaf specific volume and bread texture parameters also exhibited significant differences among the flour samples, and the flour with a high proportion of wheat bran had lower volume and denser texture. The correlation analysis confirmed that some of the main parameters of dough and pasting properties strongly correlated with bread-making qualities, and gluten strength and ash contents were closely related to the bread quality parameters in the PCA analysis, suggesting important predictive factors for bread-making properties of Korean whole wheat flour. Future research studies in this area can include the application of the classification criteria determined by ash content to various Korean whole wheat flour products and usage suggestions depending on the wheat cultivar; use of different particle sizes and addition levels of wheat bran; and utilization of other Korean domestic wheat varieties to explore the effects of bran addition on flour and wheat processed foods.
