1. Introduction
Fermented foods have long been known to be nutritionally superior because of their high protein and amino acid content (Ibrahim, 2020). Among them, soybean-based fermented foods have attracted considerable attention because of their antioxidant (Kang et al., 2016; Shin and Jeong, 2015), antitumor (Park et al., 2018), antidiabetic (Choi et al., 2016), and angiotensin-converting enzyme inhibitory properties (Sanjukta and Rai, 2016). As the oldest fermented food in East Asia, soybean-based fermented foods have a long history in the East Asian diet. However, Korean and Japanese soybean pastes have different taste, appearance, and flavor because of their manufacturing processes. Soybean paste is produced using fermented soybeans as the main ingredient. It is prepared by adding and aging dried fermented soybean paste in brine; then, the solid part is separated from the liquid and ground; finally, it is fermented for 6-24 months (Kim et al., 2022; Yi and Hong, 2021).
Doenjang (DE) is characterized by a relatively dark brown color, texture, and strong salty taste (Kim et al., 2018; Yue et al., 2021). Unlike DE, cheonggukjang (CGJ) does not have a salty taste. It is made by fermenting boiled soybeans for 2-3 days (Jeong et al., 2021). CGJ maintains the shape of a bean and has sticky mucilage and a unique odor (Kim et al., 2021). Miso (MI) uses a leavening agent called koji, which is made by fermenting wheat and barley (Devanthi and Gkatzionis, 2019). MI uses steamed soybeans, salt, and koji as the main ingredients, and it is made through a fermentation process lasting 3-24 months (Inoue et al., 2016). MI has a relatively light color and mild taste and flavor (Lee, 2022; Lee and Kim, 2016; Yue et al., 2021). Compared with Japanese MI, Korean DE and CGJ are relatively less popular in Europe and North America. Studies on DE and CGJ have focused on the standardization of the manufacturing process (Jo et al., 2011), color and quality stabilization during distribution (Chang et al., 2010), quality evaluation according to salt concentration (Jung et al., 2014), identification and separation of microorganisms in soybean paste (Jang et al., 2011; Jung et al., 2014), and analysis of changes in microorganisms with various nutrients related to fermentation and maturation in the intestine (Hati et al., 2014; Hong et al., 2012; Kumar et al., 2022). With regard to MI, studies on standardizing the manufacturing process by incorporating mutant microorganisms in the existing production process and on extending the shelf life using temperature control and pasteurization have been carried out (Allwood et al., 2021). In addition, some studies have focused on bacteria in MI (Allwood et al., 2021; Rezac et al., 2018).
In a study using SPME-GC-MS to analyze volatile compounds, 59 components including acetic acid, ethyl alcohol, and ethyl acetate were identified as volatile compounds in DE samples (Lee et al., 2015), and 46 components including aldehydes, acetic acid, 2-methylpropanal, 3-methylbutanal, 2-methylbutanal, benzaldehyde, and 1-octen-3-ol were determined as volatile compounds in MI samples (Wang et al., 2021). In the case of CGJ samples, 225 volatile compounds were detected, including 2-methyl propanoic acid, butanoic acid, 2-methyl butanoic acid, and 3-methyl butanoic acid (Baek, 2017).
As there are many studies on the fermented production process, food quality, food microbiology, and volatile compounds in Korean DE, Korean CGJ, and Japanese MI, but no studies have been suggested the comparison between the volatile compounds in Korean DE, Korean CGJ, and Japanese MI. Some studies have concluded that various volatiles in foods contribute the taste and flavors of food (Yu et al., 2022), and are essential for food quality (Wang et al., 2021). However, these studies are based on a subset of volatiles in the samples used in the study, missing the analysis of the total volatiles present in the samples. Therefore, a systematic study on the flavor characteristics of soybean paste is needed to reveal the differences in volatile components between DE, CGJ, and Mi to improve the quality of each product for globalizing it.
A simultaneous distillation and extraction method is used to analyze the volatile components of food. However, it is time-consuming and uses a solvent to generate contaminated by-products. Alternatively, solid-phase microextraction (SPME) is used as a supplementary method (Wei et al., 2021). Compared with other analytical methods, SPME is easy to operate, has excellent repeatability, and is highly sensitive, allowing low-concentration samples to be collected (Abdulra’uf and Tan, 2015; Jeleń et al., 2012). In addition, it has the advantage of directly extracting and concentrating volatile components on fused-silica-coated fibers without a solvent (Wang et al., 2020; Wu et al., 2021; Yang and Peppard, 1994; Zeng et al., 2020). In the present study, we identified the volatile components in DE, CGJ, and MI using SPME and analyzed their correlation between soybean pastes.
2. Materials and methods
DE, CGJ, and MI samples used in this study were generally commercially available soybean paste that was easy to purchase. They had similar expiration date (October 2022, about 3 months from the date of purchase) and were stored at 4°C until use. The selected samples are shown in Table 1. NaCl used in the extraction of volatile components of each sample was purchased from Sigma-Aldrich (St. Louis, MO, USA) in the form of a solid with a molecular weight of 58.44 and a purity of 99.0%. Hexadecane used as an internal standard was purchased from Sigma-Aldrich in liquid form with a molecular weight of 226.44 and a purity of 99.0%.
For the collection of volatile components, 3 g of each homogenized sample was placed in a 20 mL headspace glass vial (Supelco Inc., Bellefonte, PA, USA) and added with 10 mL of distilled water and a certain amount of NaCl (0-2 g). After adding 8 μL of hexadecane (0.773 g/mL) as an internal standard, the vial was sealed with a silicon/teflon septum (Supelco Inc). The sealed vial was stirred (350 rpm) at constant temperature (40°C-80°C) for 60 min using a magnetic bar to create an equilibrium state. Then, an SPME fiber was inserted to adsorb volatile components for a certain period of time (10-50 min). The sample was analyzed by desorption for a certain period of time (1-10 min) at 270°C using the gas chromatography-mass spectrometry (GC-MS) injection port. Divinylbenzene/carboxen/polydimethylsiloxane (DVB/CAR/PDMS) (1 cm, 50/30 μm, Supelco Inc), which is easy to collect and concentrate in a wide range, was used for adsorption of volatile components in each sample (Risticevic et al., 2010). DVB/CAR/PDMS has a three-layer structure, wide adsorption range, and high adsorption amount (Zhang et al., 2011). The volatile component collection experiment was repeated three times for each sample to increase reproducibility.
The SPME optimization experiment was conducted by setting several variables (Wang et al., 2017). The total area of the detected material and GC-MS chromatogram peaks were confirmed for a total of four variables: NaCl addition, stirring temperature, adsorption time, and desorption time. The remaining variables were fixed, while one variable was optimized. The SPME optimization variables used in the experiments are shown in Table 2, and these experiments were repeated three times.
| Optimization | Levels of optimization parameter | ||||
|---|---|---|---|---|---|
| NaCl addition (g) | 0.0 | 0.5 | 1.0 | 1.5 | 2.0 |
| Heating temperature (°C) | 40 | 50 | 60 | 70 | 80 |
| Extraction time (min) | 10 | 20 | 30 | 40 | 50 |
| Dissociation time (min) | 1 | 3 | 5 | 7 | 10 |
Each volatile component was analyzed by applying GC-MS (Clarus 680 Gas Chromatograph/Clarus 600T Mass Selective Detector, PerkinElmer, Waltham, MA, USA). The Elite-5MS column (60 m×0.32 mm×1 μm film thickness, PerkinElmer) was used for the analysis. Helium (99.99%) was used as the mobile-phase gas, where the flow rate was maintained at 1.0 mL/min. The oven temperature was maintained at 35°C for 5 min. Then, it was increased to 220°C at a rate of 10°C/min and maintained for 20 min. The inlet temperature was 270°C, and analysis was performed in splitless mode. The ionization voltage was 70 eV, and the m/z range was 35-350 m/z.
The detection time and MS data for the volatile peaks detected in each sample were compared, and the Kovats index (RI) was calculated. Each volatile component peak was identified by comparing with the standard retention index recorded in the NIST 17 Mass Spectral Library (Gaithersburg, MD) document. The content of volatile components detected in the sample was expressed as ng/g fresh weight (FW) value through a semi-quantitative procedure using the peak area of each volatile component and the peak area of hexadecane added as an internal standard based on total GC.
Data from SPME followed by GC-MS (SPME-GC-MS) were normalized using R software 4.0.3 (R Foundation for Statistical Computing, Vienna, Austria). Principal component analysis (PCA) was performed using SIMCA 14.1 software package (Umetrics., Umea, Sweden) to assess similarities and differences between each sample. All data represent the average of three experiments.
3. Results and discussion
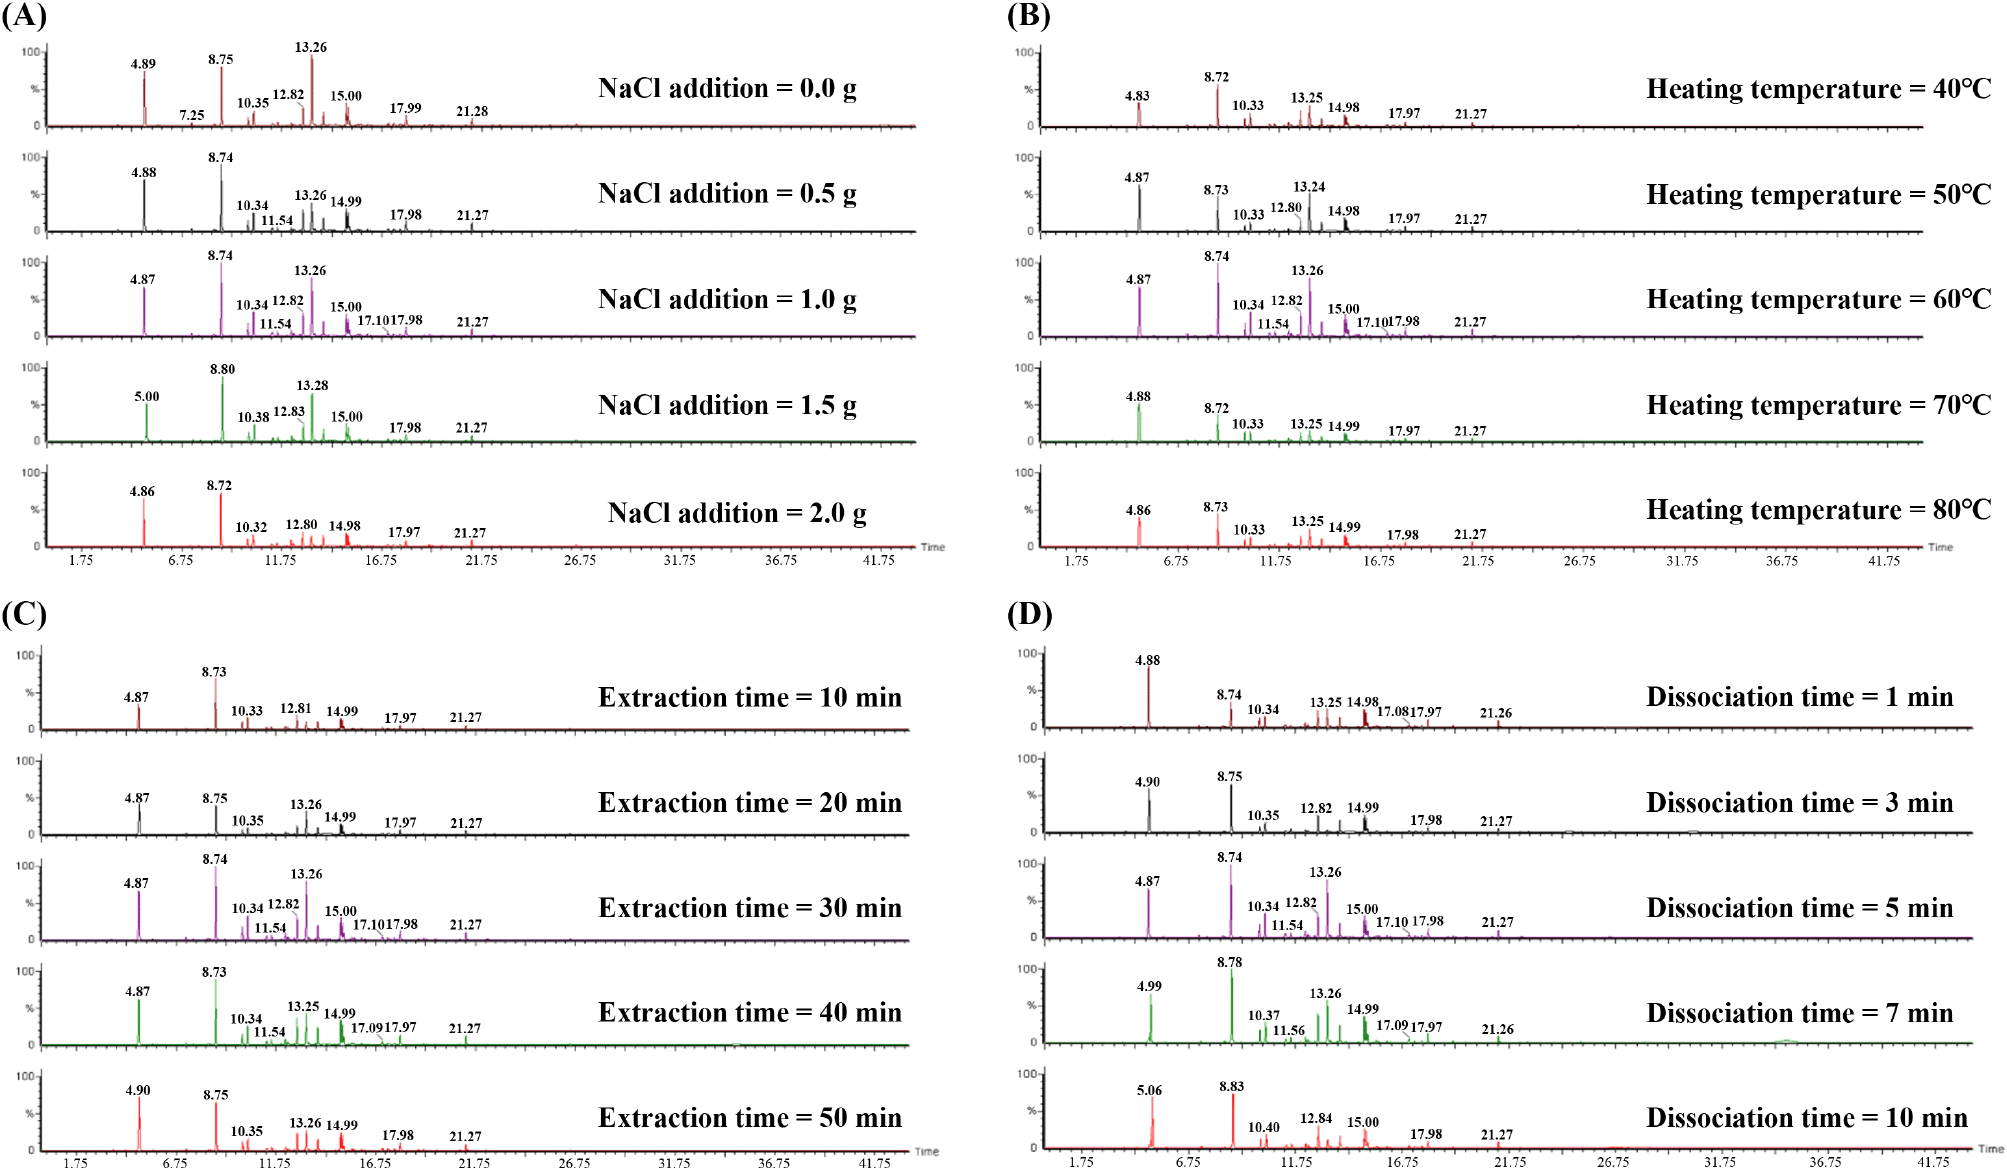
The accuracy and reliability of SPME can be influenced by many variables including type of SPME fiber, sample weight, NaCl addition, heating temperature, equilibration, and extraction and separation time (Cuevas-Glory et al., 2015; Ma et al., 2013; Tang et al., 2018). During the evaluation of the SPME optimization experiment, the total number and area of components were distinguishable from the GC-MS chromatogram peaks. Fig. 1 shows the total peak area and optimal experimental conditions with NaCl addition, stirring temperature, adsorption time, and desorption time as the variables.

The detection of volatile components according to NaCl addition was divided into a control group (without NaCl addition) and sample group (the amount of NaCl added was increased by 0.5 g). In particular, the detection amount was the highest when 1.0 g of NaCl was added. Thereafter, the detection amount decreased as the amount of NaCl increased (Fig. 1A). When an appropriate amount of NaCl is added to the sample, the volatile components increases as the amount of ionic strength increases (Wei et al., 2021). However, when the amount of NaCl increases, the ion interacts electrostatically with molecular substances volatilized from the sample and weakens the diffusion rate, thereby interfering with the detection of volatile components (Spietelun et al., 2010). This is consistent with the results of our study. From the NaCl addition variable experimental results, 1.0 g of NaCl was found to be the most suitable.
The second variable experiment, which investigated the amount of volatile components detected according to sample agitation temperature, was carried out at 40°C. Then, the temperature was increased by 10°C-80°C. The content of volatile components increased as the stirring temperature increased up to 60°C, and the content decreased when the temperature was increased above this temperature (Fig. 1B). This is because the amount of volatilized components per unit time increases as the heating temperature increases, but the amount of volatile components adsorbed under the influence of moisture and vapor pressure decreases at high temperatures (Lim et al., 2018; Risticevic et al., 2010). The amount of volatile components increases above 60°C, but the adsorption of SPME fibers decreases. Thus, the effect of temperature hindering adsorption was greater than the increase in the amount of volatile components detected. Based on this result, the ideal stirring temperature was set to 60°C.
The third variable experiment, which investigated the amount of volatile components detected according to sample extraction time, proceeded by increasing the extraction time by 10 min from 10 min to 50 min. The adsorption amount increased as the extraction time increased. After 30 min, the amount of adsorbed material tended to decrease (Fig. 1C). This is presumed to be due to the competition of molecules for adsorption and desorption on the SPME fiber. As the extraction time increases, molecules are adsorbed in a wider range. However, previously adsorbed substances may be desorbed during long-term adsorption (Balasubramanian and Panigrahi, 2011; Trujillo-Rodríguez et al., 2017). Therefore, the most suitable extraction time for the sample was 30 min.
The fourth variable experiment investigated how the amount of volatile components detected changes according to desorption time, which is the first step of GC-MS analysis. The desorption time was set to 1, 3, 5, 7, and 10 min and gradually increased. In the variable experiment, when the desorption time was less than 3 min, a low peak was detected for the same time period, indicating that some components were not completely desorbed. Moreover, there was almost no significant difference in the detected amount between 5 min and 10 min (Fig. 1D). This is generally considered to be the same phenomenon, where the amount of low-volatility substances detected changes according to desorption time, whereas high-volatility substances are hardly affected by desorption time (Lim et al., 2018). Therefore, the most appropriate desorption time was 5 min.
The results of volatile content analysis of 5 types of DE, 3 types of CGJ, and 5 types of MI using SPME are shown by chemical grades, chemical formulas, RI values of the Elite-5MS column, and relative concentrations (Table S1). In all samples, 16 kinds of esters, 8 kinds of alcohols, 2 kinds of acids, 4 kinds of pyrazines, 2 kinds of furans, 8 kinds of ketones, 5 kinds of aldehydes, and 8 kinds of hydrocarbons were found. Fifty-three kinds of volatile components were detected. Thirty-two volatile components were identified in DE (12 esters, 3 alcohols, 1 acid, 1 pyrazine, 2 furans, 1 ketone, 4 aldehydes, and 8 hydrocarbons). Thirty-seven volatile components were detected in CGJ (9 esters, 5 alcohols, 1 acid, 4 pyrazines, 1 furan, 8 ketones, 2 aldehydes, and 7 hydrocarbons). Meanwhile, 28 volatile components were found in MI (7 esters, 7 alcohols, 2 furans, 5 aldehydes, and 7 hydrocarbons). Acids, pyrazines, and ketones were not found. Esters and hydrocarbons accounted for the highest ratio in all samples. Two types of esters (ethyl acetate and isoamyl acetate), two types of alcohols (3-methyl-1-butanol and 1-octen-3-ol), two types of aldehydes (3-methyl-butanal and 2-methyl-butanal), and 6 types of hydrocarbons (octane, nonane, decane, dodecane, tetradecane, pentadecane) were commonly found.
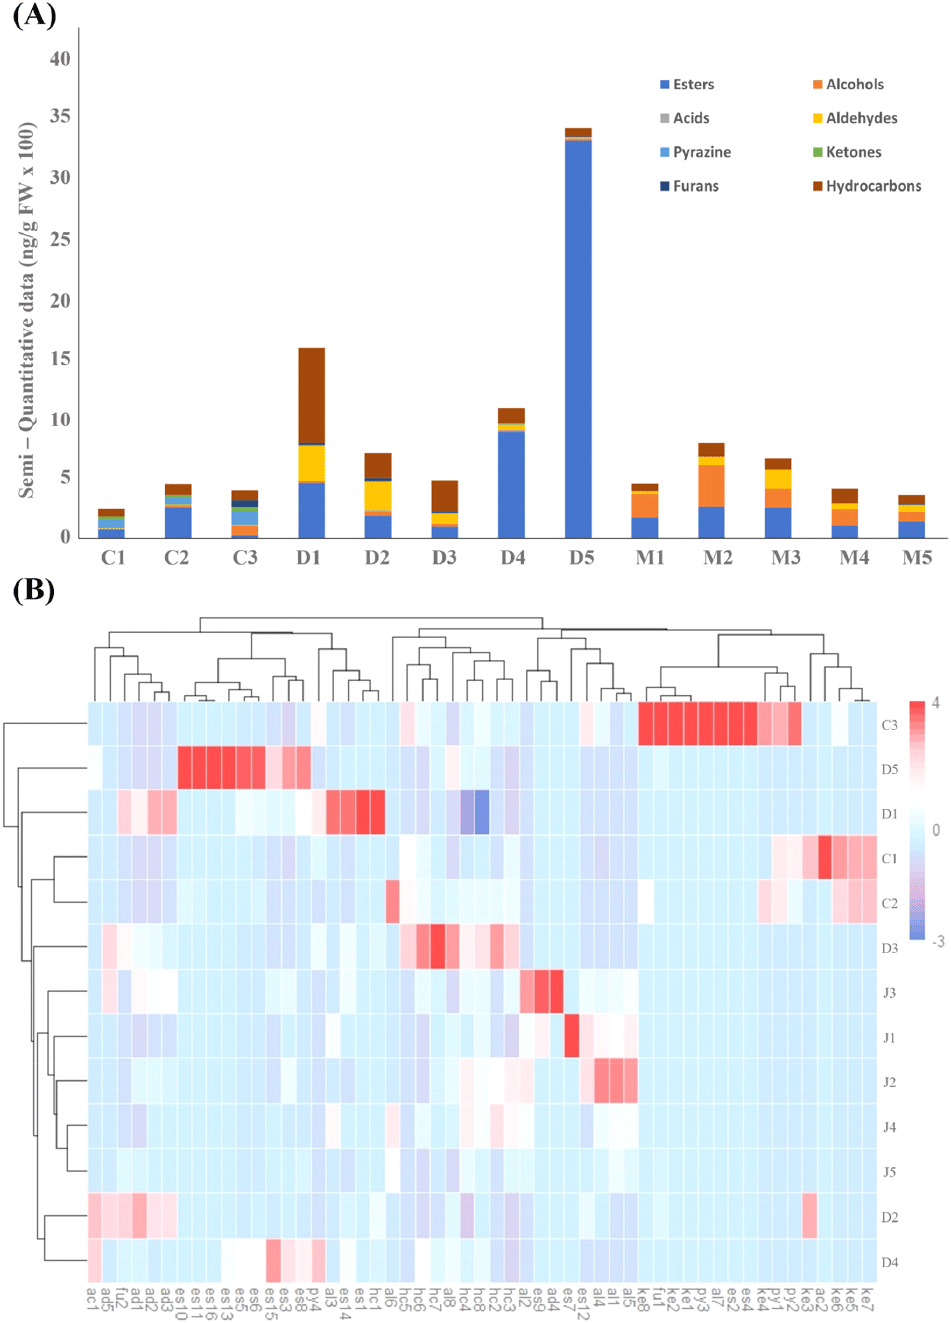
Quantitative analysis of volatile components showed that esters and hydrocarbons accounted for approximately >55% of the total volatile components in DE, CGJ, and MI samples. The sum of the relative concentration percentages of esters and hydrocarbons was approximately 80.12% in DE, 54.17% in CGJ, and 53.58% in MI. In conclusion, there were some differences in the type and amount of volatile components, which are the main components, for each soybean paste; however, the overall volatile components showed a similar pattern. The semi-quantitative results of volatile components of each sample are shown in Fig. 2A. As a result of hierarchical cluster analysis according to the composition of volatile components in all samples, C1-C2, J4-J5, and D2-D4 showed similar results. J4-J5 showed a similar pattern to J2, showing correlation between each soybean paste sample (Fig. 2B).

Esters commonly found in all 13 samples were closely related to the esterification of alcohols and acids during soybean paste fermentation and detected in large amounts. Esters have sweet and fruity flavors, which play a role in developing the aroma characteristics of soybean paste (Yu et al., 2022). Ethyl acetate, which showed the highest detection amount among esters, is one of the main fragrance substances of soybean pastes and used as an index to check their maturity. Ethyl acetate has a pineapple-like aroma (Kim and Lee, 2018), and its accumulation increases with fermentation time (Zhao et al., 2011). The appearance of ethyl acetate in all samples indicates that an esterification reaction occurred between free fatty acids and ethanol (Lee and Ahn, 2009), which is consistent with the results of this study. Thus, it can be seen that the same reaction occurred in DE, CGJ, and MI.
Pyrazines, which were detected in large quantities in CGJ, are produced during protein decomposition by heat (Peng et al., 2014) and provide soybean paste with a nutty flavor. Pyrazines act as an important aroma component in soybean paste fermentation (Zhao and Fleet, 2014) and are responsible for the irritating and unpleasant taste of CGJ (Cho et al., 2017). The results of this study were consistent with those of Jiang and Lee (2013), who found that pyrazines are the main volatile components of soybean paste (Jiang et al., 2013). Aldehydes, which were highly detected in all samples, are produced through lipid oxidation and decomposition during soybean paste fermentation. They improve the flavor of soybean paste by providing sweet, fruity, nutty, and caramel flavors (Ling et al., 2022).
Aldehydes are present in high levels in MI, and koji added during the manufacturing process of MI contains 2-methyl-propanal, 2-methyl-butanal, and 3-methyl-butanal through biosynthetic enzymes/microbiological pathways (Giri et al., 2010; Inoue et al., 2016). In this study, a large amount of these three aldehydes was detected in MI. Alcohols, which are found in large amounts in microbes along with aldehydes, are mainly produced via the enzymatic degradation of fungi (Peng et al., 2014). Koji, which is added when making MI, is composed of soybeans or wheat fermented with mold, which plays a role in decomposing carbohydrates and proteins (Zhu and Tramper, 2013). Alcohols appear to have been generated in large quantities in MI. Alcohols generally have floral, sweet, and honey scents (Ding et al., 2020), and MI is thought to have a mild and soft flavor because of alcohols produced in large quantities in MI.
Ketones, which were not detected in soybean paste and MI, are produced through the action of fungal enzymes on amino acids in soybean paste, and their contribution to soybean paste appears to be low because of their low content (Ferreira et al., 2015; Zhao et al., 2011).
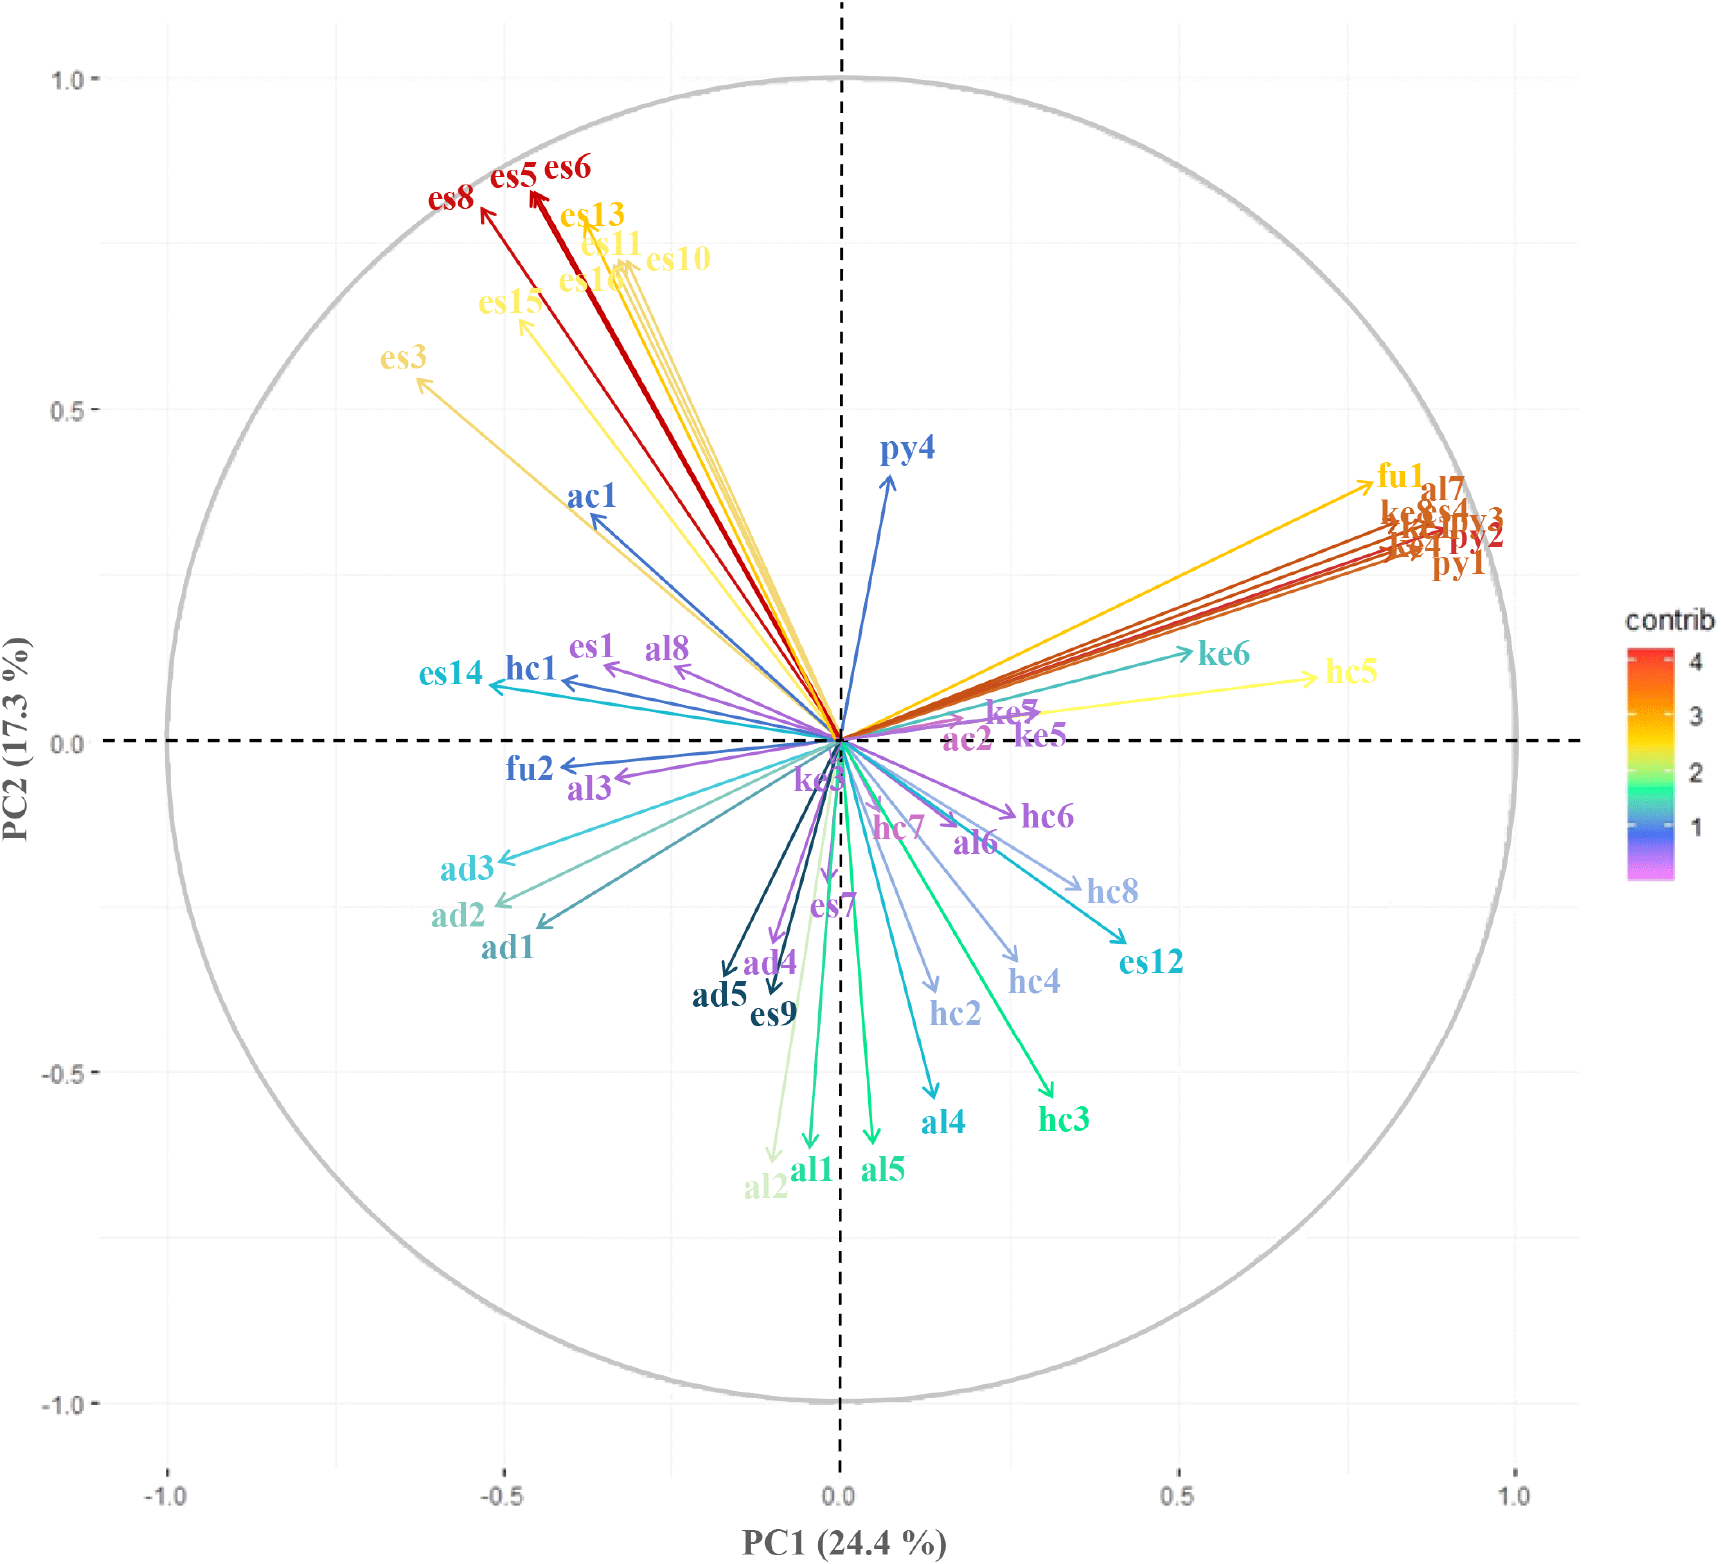
PCA was performed to analyze the content of volatile components of all 13 samples using SPME-GC-MS. The PCA results using the 53 volatile components detected are shown in Fig. 3. Principal component (P) 1 and 2 represented a two-dimensional model that explained 24.4% and 17.3% of the total data variance, respectively. Moreover, the cumulative variance contribution of PC1 and PC2 was 41.7%. According to the analysis results, the main volatile components of DE appeared in the 2nd quadrant, whereas those of CGJ were located in the 1st quadrant. Volatile components highly related to MI were mainly located between the 3rd and 4th quadrants.

In the second quadrant, esters such as ethyl propanoate, ethyl isobutyrate, ethyl butanoate, and ethyl isohexanoate showed a high correlation with DE. In the first quadrant, 2,5-dimethyl-pyrazine, trimethyl-pyrazine, 3-ethyl-2,5-dimethyl-pyrazine, tetramethyl-pyrazine, and 2-methyl-furan showed a high correlation with CGJ. In the 3rd and 4th quadrants, alcohols such as 2-methyl-1-propanol, 1-butanol, 3-methyl-1-butanol, and 2-methyl-1-butanol showed a high correlation with MI.
This result is consistent with our results described in Section 3.2, which quantitatively analyzed the volatile components of each sample, and shows that there is a difference in the main volatile components of each sample. Through this, it is possible to visually grasp the volatile components with high correlation for each sample of soybean paste, which is beneficial in comprehensively evaluating the volatile components of soybean paste. The results of this study will be used for quality improvement of soybean paste to promote the globalization of soybean-based fermented foods.
4. Conclusions
This study compared and analyzed the volatile components of DE, CGJ, and MI using SPME-GC-MS. Thirty-two types of volatile components were identified in DE, 37 in CGJ, and 28 in MI. Depending on the chemical properties, 16 types of esters, 8 types of alcohols, 2 types of acids, 4 types of pyrazines, 2 types of furans, 8 types of ketones, 5 aldehydes, and 8 hydrocarbons were identified. Two types of esters (ethyl acetate and isoamyl acetate), 2 types of alcohols (3-methyl-1-butanol and 1-octen-3-ol), 2 kinds of aldehydes (3-methyl-butanal and 2-methyl-butanal), and 6 kinds of hydrocarbons (octane, nonane, decane, dodecane, tetradecane, pentadecane) were commonly found in all samples. Esters and hydrocarbons accounted for approximately >55% of the total volatile components, and the sum of the relative concentrations was approximately 80.12% in DE, 54.17% in CGJ, and 53.58% in MI. PCA of the volatile components showed that esters (ethyl propanoate, ethyl isobutyrate, ethyl butanoate, and ethyl isohexanoate) were highly correlated with DE; 2,5-dimethyl-pyrazine, trimethyl-pyrazine, 3-ethyl-2,5-dimethyl-pyrazine, tetramethyl-pyrazine, and 2-methyl-furan were correlated with CGJ; and alcohols (2-methyl-1-propanol, 1-butanol, 3-methyl-1-butanol, and 2-methyl-1-butanol) were highly correlated with MI. In conclusion, there is a difference in the main volatile components of DE, CGJ, and MI. Each soybean paste is made from soybean, so the overall volatile content shows a similar pattern. However, there are some differences in the type and content of main volatile components in each product. Accordingly, each product has different fragrances. The results in this study will be used as a basis for soybean paste analysis and quality improvement, and will help to accelerate the globalization of soybean fermented foods. Furthermore, it is necessary to validate the control mechanisms on the volatile components in soybean fermented foods to increase consumer preference, which is expected to develop into a new research field.


