1. Introduction
In recent years, the health landscape has notably evolved, emphasizing the improvement of nutrition by changing dietary habits (Chopra et al., 2022). Health-conscious consumers are increasingly opting for food products with the aim of preventing negative health consequences, particularly chronic diseases such as cancer and diabetes. This trend has given rise to the functional foods market, which are products containing bioactive constituents to maintain optimum human health (Tsoupras et al., 2023) Innovations have contributed to significant market growth, reaching its peak during the COVID-19 pandemic (Fortune Business Insights, 2019; Lordan, 2021). Moreover, consumers are actively seeking beverages that offer enhanced functionality, leading to a surge in demand for functional beverages with innovative properties. This growing interest has propelled the market to significant value (Gonçalves et al., 2022).
Lactic acid fermentation represents a biotransformative food processing method, most especially for plant-based beverages, as it leads to enhancing health benefits (Plessas, 2021). This process significantly impacts the bioavailability of beneficial fruit juice components through the metabolic actions of lactic acid bacteria (LAB). The most frequent species of LAB involved in the fermentation of plant-based substrates, such as fruits, are Lactiplantibacillus plantarum, Lb. brevis, Lb. rhamnosus, Lb. acidophilus, Leuconostoc mesenteroides, Lc. citreum, Lc. fallax, Lc. kimchi, Pediococcus pentosaceus, P. acidilactici, Weissella confusa, W. cibaria. Interestingly, L. plantarum, became of great interest in research because of its enzyme systems, which can hydrolyze or produce important compounds (Septembre-Malaterre et al., 2018). One major finding showed that LAB, particularly L. plantarum, which is common in most plant-based fermentation, can convert polyphenols into bioactive derivatives through phenolic acid enzyme actions, resulting in enhanced bioavailability for humans (Filannino et al, 2018). LAB-fermented juices also exhibit functional properties, such as increased nutrient density through the bioconversion of sugars (Septembre-Malaterre et al., 2018), improved nutrient bioavailability (Filannino et al, 2018), and enhanced antioxidant activity (Li et al., 2019). In a similar study done by Vivek et al. (2019), the Sohiong juice fermented by L. plantarum exhibited an increase in the antioxidant properties and total phenolic and anthocyanin contents. Reviews also indicate the health-promoting properties of various LAB-fermented plant-based beverages (Szutowska, 2020). These include antidiabetic, anti-inflammatory, and anticancer effects, and an impact on reducing obesity. Thus, lactic acid fermentation can be considered a strategic method for food supplementation in addressing chronic diseases and obesity.
The Antidesma bunius (L.) Spreng. (bignay) tree, which bears clusters of small fruits, has a genus with 150 species distributed across Asia, Africa, Australia, and the Pacific Islands (Crieta et al., 2022; Islam, 2018). It is known as bignay or bugnay (Philippines), buni or berunai (Malaya, India), wooni or hooni (Indonesia), ma mao luang (Thailand), kho lien tu (Laos), choi moi (Vietnam), and moi-kin or chunka (natives in Queensland). The ripe fruits are commonly consumed directly, although their uptake is limited due to the tart taste and potential for deep purple pigment stains upon consumption (Carbonera, 2023). To enhance their appeal and usability, various processing methods, such as sugar concentration, have been employed to produce jams, jellies, and preserves. Additionally, fruit concentrates are frequently utilized to produce tropical fruit wine through alcoholic fermentation and ready-to-drink juice through pasteurization (Gestupa, 2015). The existing A. bunius fruit products play a crucial role in commercialization, contributing to economic value, extending shelf life, and enhancing nutritional content.
The mature fruits exhibit rich polyphenolic content, notably from two of the major families, namely phenolic acids and flavonoids (Gestupa et al., 2016; Sartagoda et al., 2021). Among the flavonoids, anthocyanins contribute significantly to the vibrant color of the fruit and play a significant role during fermentation (Palencia-Argel et al, 2022). Ripe A. bunius concentrate has been identified to possess high levels of total polyphenols and anthocyanins (Hardinasinta, 2021). Known for their potent antioxidant activities, these polyphenols are associated with a potential risk reduction in cancer (Zubia, et al., 2023). Additionally, in vivo studies involving the fruit have demonstrated a notable decrease in blood glucose levels (Udomkasemsab et al., 2019), suggesting a potential link to reduced risk of diabetes.
The objective of this study is to evaluate the changes in the physicochemical properties, polyphenolic contents, and biological activities of A. bunius fruit juice as influenced by lactic acid fermentation. This utilization represents an approach to investigate the enhancement of nutritional and health-promoting effects, based on changes in the amounts of polyphenols and biological activities, towards the development of innovative functional food products and ingredients for nutrition and health.
2. Materials and methods
The ripe fruits of A. bunius ([L.] Spreng var. Common) were procured from locations in Laguna, Philippines, and transported to the Institute of Food Science and Technology (IFST), UP Los Baños. After a thorough washing under running tap water to eliminate any contaminants, the fruits were placed in polyethylene (PE) bags and stored in the freezer until use. Upon thawing, the fruits were homogenized using a commercial blender. The puree was then filtered to separate the pulp from the juice (yield: 81.82%; total soluble solids: 7 °Brix; pH 2.93).
For juice preparation, concentrations of 25%, 50%, and 75% v/v were made by dilution with distilled water. The total soluble solids (TSS) of the samples were adjusted to 12 °Brix while the pH was adjusted to 4.0 with food-grade sodium bicarbonate. Rapid pasteurization as applied in acid or acidified beverages such as fruit juices was done by heating 1 L of each juice sample to 85°C for 1 min. Pasteurization temperature was reached after 7 min. The juice samples were allowed to cool to 37°C in a thermostatically controlled water bath prior to inoculation with lactic acid bacteria.
A pure culture of L. plantarum BIOTECH 1223 (Philippine National Collection of Microorganisms, Philippines) was used as a starter culture for A. bunius juice fermentation, which was cultured in sterile De Man, Rogosa, and Sharpe (MRS) broth (Biokar Diagnostics, Allonne, France). The pure culture was incubated with shaking (BJPX-2102D, Biobase, Shandong, China) at 37°C and 100 rpm for 16 h. Consequently, the L. plantarum cells were washed twice using a sterile 0.1% saline solution at 2,739 ×g for 20 min. The cells were then aseptically inoculated to the prepared A. bunius juices at the rate of 1% of the volume of the juice. The juice samples were incubated with shaking at 37°C and 100 rpm for up to 96 h. Sampling was done every 24 h for analysis. At each sampling point, the juice samples were pasteurized at 85°C for 1 min to ensure non-interference of the bacteria in the analysis.
The analysis of total polyphenol content (TPC) employed the Folin-Ciocalteu colorimetric method (Lizardo et al., 2020), with absorbance measured at 760 nm using a 96-well plate microplate reader (BK-EL10C, Biobase). The results were quantified in terms of mg gallic acid equivalents (GAE) per mL sample. Meanwhile, the analysis of total flavonoid content (TFC) employed the aluminum chloride colorimetric method (Fattahi et al., 2014) with few modifications. Absorbance was measured at 492 nm using a microplate reader, and the results were expressed as mg quercetin equivalents (QE) per mL sample. The total monomeric anthocyanin content was determined through a modified pH differential method (Giusti and Wrolstad, 2001). Twenty μL of prepared sample were mixed separately with 100 μL potassium chloride buffer (pH 1.0, 0.025 M) and 100 μL potassium acetate buffer (pH 4.5, 0.4 M). The mixtures were held at room temperature for 20 min. The absorbances of separate mixtures were measured using a microplate reader at 520 nm and 700 nm. The TAC was computed using Equation (1) and expressed as mg cyanidin-3-glucoside equivalents (C3GE) per L sample.
Where A is the absorbances (A520nm - A700nm)pH 1.0 - (A520nm - A700nm)pH 4.5, MW is the molecular weight of cyanidin-3-glucoside (449.2 g/mol), DF is the dilution factor, ∊ is the molar extinction coefficient of cyanidin-3-glucoside (26,900 L mol−1 cm−1), l is the cell pathlength for microplate reader (0.3 cm), and 103 is the conversion factor from g to mg.
Based on the result of the total phytochemical content screening, the selected concentration and fermentation time were 75% v/v and 0-72 h, respectively.
L. plantarum count was evaluated every 24 h through the standard plate count method (American Public Health Association, 2018) using MRS agar as the culture medium. Subsequently, the pH, TSS, and total titratable acidity (TTA) of the juice samples were determined. The TSS was measured using a refractometer. The pH was measured using a benchtop pH meter (AB33PH-B, OHAUS Instruments, Shanghai, China). The TTA was measured using the method employed by Tyl and Sadler (2017) and was calculated using Equation (2):
Where N is the normality of NaOH (mEq/mL); V1 is the volume of NaOH (mL); Eq. wt. is the equivalent weight of lactic acid (90.08 mg/mEq); V2 is the volume of sample (mL).
The method parameters employed in this study were adapted from Flandez et al. (2023) and utilized a High-Performance Liquid Chromatography (HPLC) system (Shimadzu, Tokyo, Japan), as described in the same author’s work. Before conducting the HPLC analysis, the samples were prepared through a 25-fold dilution process. This involved combining 1 gram of the sample with 25 mL of an extractant solution comprising a 50% methanol solution (RCI Labscan, Bangkok, Thailand) acidified with 1% glacial acetic acid (RCI Labscan). The quantification was determined using standard curves derived from the adopted method, and concentrations were expressed as mg polyphenol per mL sample.
The antioxidant activities of the juice samples were analyzed in comparison to a 0.1% solution of the butylated hydroxyanisole (BHA) standard (Sigma-Aldrich, Darmstadt, Germany). This involved evaluations of free radical scavenging, reactive oxygen species (ROS) scavenging, and reducing power. Free radical scavenging activities were assessed using 1,1-diphenyl-2-picrylhydrazyl (DPPH•) radical (Loba Chemie, Mumbai, India) and 2,2′-Azino-bis(3-ethylbenzothiazoline-6-sulfonate) diammonium salt (ABTS•+) radical (Sigma-Aldrich). The protocols by Lizardo et al. (2020) and González-Palma et al. (2016) were followed for DPPH• and ABTS•+ scavenging activities, respectively. Additionally, ROS scavenging involving hydrogen peroxide (H2O2) employed the procedure outlined by Lizardo et al. (2020). The absorbances for the DPPH•, ABTS•+, and H2O2 assays were measured at 540, 700, and 405 nm, respectively, using a microplate reader. The scavenging activities, expressed as percentages, were calculated using Equation (3).
Where A0 is the absorbance of the blank, and A1 is the absorbance of the sample.
Concurrently, the reducing power of the samples was assessed by adopting the method employed by Lizardo et al. (2020). The absorbance values were measured at 700 nm using a microplate reader. The reducing power, determined through the reduction of Fe3+ (FRAP Value), was computed31 using Equation (4).
Where A1 is the absorbance of the sample, A0 is the absorbance of the blank, and AC is the absorbance of the control (0.1% BHA standard).
The inhibitory effects on α-amylase (derived from Aspergillus oryzae, Sigma-Aldrich) and α-glucosidase (derived from Saccharomyces cerevisiae, Sigma-Aldrich) were evaluated using the selected fermented samples, with 0.1% w/v acarbose (Tokyo Chemical Industry, Tokyo, Japan) employed as the standard enzyme inhibitor. The α-amylase inhibitory activity assay was based on the methodology by Kazeem et al. (2013) with slight modification. Briefly, 250 μL of the prepared sample was combined with 250 μL of α-amylase solution (0.5 mg α-amylase powder per mL 0.02 M sodium phosphate buffer pH 6.9). After pre-incubation for 10 minutes at room temperature, 250 μL of a 1% solution of soluble starch (Loba Chemie) was added as the substrate. The reaction mixture was incubated for an additional 10 minutes at room temperature. Following this, 96 mM of 3,5-Dinitrosalicylic acid (DNS) coloring reagent was introduced, and the mixture was incubated in an 80°C water bath for 5 minutes. The cooled mixture was then transferred to a 96-well plate, and absorbance was measured at 492 nm. The % inhibition activity was calculated (Lankatillake et al., 2021; Sun et al., 2024) using Equation (5).
Additionally, the α-glucosidase inhibitory activity, adopted from Lizardo et al. (2020), involved an absorbance assay with p-Nitrophenyl α-D-glucopyranoside (p-NPG) (Sigma-Aldrich) as the substrate, measured at 405 nm in microplate reader to determine p-nitrophenol. The % inhibition activity was computed using Equation (6). The percentage inhibition of the samples was standardized by normalizing it against the percentage inhibition obtained with the acarbose standard (Lankatillake et al., 2021; Sun et al., 2024).
Where A is the absorbance of the reaction mixture containing enzyme solution but no sample, a is the absorbance without enzyme solution and sample, B is the absorbance containing enzyme solution and sample, and b is the absorbance containing sample but no enzyme solution.
The analyses were conducted in triplicate, and the results were expressed as mean±standard deviation. Microsoft® Excel for Mac Version 16.81 (24011420) (Microsoft, Redmond, WA, USA) was employed to generate the computed dataset and graphs. Using jamovi Version 2.3.3 (The jamovi project, New South Wales, Australia), Analysis of Variance (ANOVA) was initially conducted, followed by Tukey’s test (p<0.05), to identify significant differences among variables (fermentation time and juice dilution levels). Post-hoc pairwise comparisons of all treatment means were carried out using the software developed by Assaad et al. (2015).
A chemometric evaluation was performed using RStudio (Posit Software, Boston, MA, USA) Version 2023.06.1+524. The assessments comprised Pearson’s correlation matrix and Principal Component Analysis (PCA) biplot to elucidate the relationships among the polyphenolic contents of the fermented samples and their biological activities.

3. Results and discussion
The physicochemical properties throughout the fermentation process were monitored to determine the effect of the process at the specified time period. Fig. 1A and 1B presents the changes in L. plantarum count, TSS, pH, and over fermentation time until 72 h. The cell population (Fig. 1A) initially decreased by 1.5 log cycles after 24 h (7.94 log CFU per mL), followed by an increase in the 48th and 72nd hour (8.38-8.43 log CFU per mL) of fermentation. Nonetheless, the L. plantarum count towards the end of the fermentation was lower than the initial count.
Meanwhile, a significant drop in TSS by 4 °Brix after 72 h of fermentation was observed (p<0.05). Fig. 1B illustrates a decrease in pH from 4.3 to 3.8 and a significant increase in TTA from 0.62% to 1.17% during the 72-hour fermentation period (p<0.05), indicating the production of organic acids, primarily lactic acid (Tian et al., 2019).
The growth of L. plantarum during fermentation aligns with findings in different studies, showing a sharp decline (Mustafa et al., 2019) and a subsequent recovery (Fazeli et al., 2011). The initial drop in cell count could be attributed to the adjustment phase of the microorganisms as the substrate contains high amounts of phenolics and organic acids, which may be detrimental to their growth (Fazeli et al., 2011; Mousavi et al., 2011; Nualkaekul et al., 2012; Sheehan et al., 2007) and potentially leading to changes in the membrane fatty acid composition of L. plantarum (Rozès and Peres, 1998). The subsequent increase in the bacterial count is influenced by the prebiotic properties of anthocyanin and its monomer (Zhu et al., 2018) A. bunius fruit concentrate, known for its high anthocyanin content (Hardinasinta et al., 2021), provides these compounds that promote increased LAB viability. The viability of L. plantarum throughout the fermentation can be associated with the decrease in TSS and pH and the increase in TTA, possibly resulting from bacterial metabolism of the fruit’s significant secondary metabolites, such as anthocyanin (Palencia-Argel et al., 2022). The catabolism produces simpler polyphenols with superior antioxidant activity compared to the precursors (Ruiz Rodríguez et al., 2021).
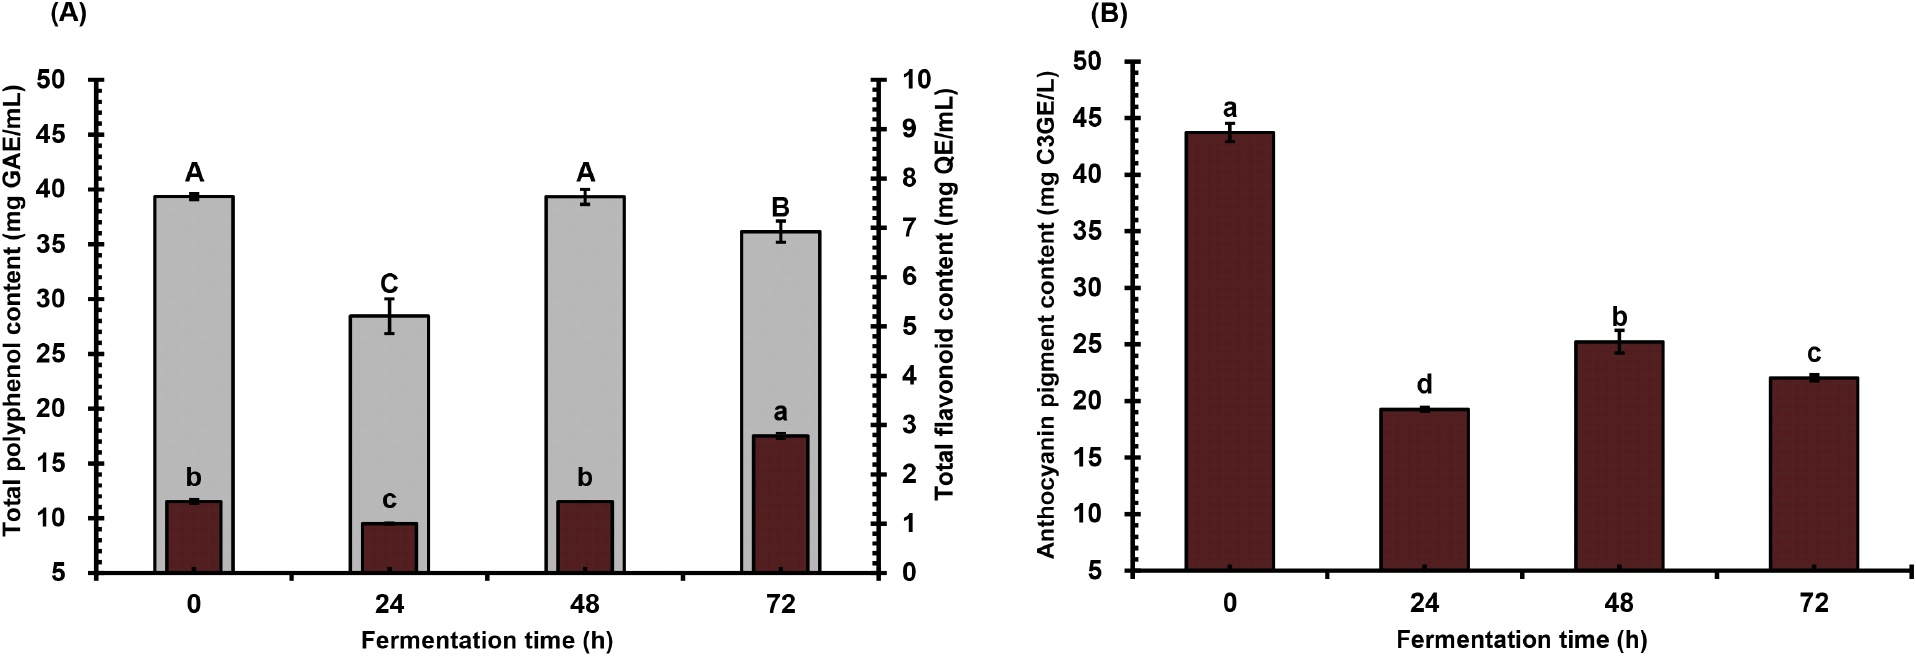
To determine the effect of lactic acid fermentation by L. plantarum on the total phytochemical and specific phenolic contents of A. bunius juice over time, the total polyphenol, total flavonoid, and total anthocyanin contents were measured, and results are shown in Fig. 2. The highest and lowest total polyphenol concentrations were observed at 48 hours (39.33 mg GAE/mL) and 24 hours (28.44 mg GAE/mL) of fermentation, respectively (Fig. 2A). Meanwhile, the total flavonoids displayed an overall increasing trend, characterized by a substantial increase starting from 1.45 mg QE/mL at 48 hr fermentation period. The results show that at a particular time and point during fermentation, an improvement and possible evolution of the phenolic content of the fruit juice occur, which may differ based on the substrate and microorganisms involved. Meanwhile, Fig. 2B illustrates the dynamics of total monomeric anthocyanin content. The graph demonstrates an initial marked decrease (19.26 mg C3GE/L), succeeded by a significant increase (25.23 mg C3GE/L), and then undergoes another substantial decrease (22.04 mg C3GE/L). Notably, the anthocyanin concentrations observed during fermentation declined and are significantly lower compared to the unfermented juice sample (43.73 mg C3GE/L).
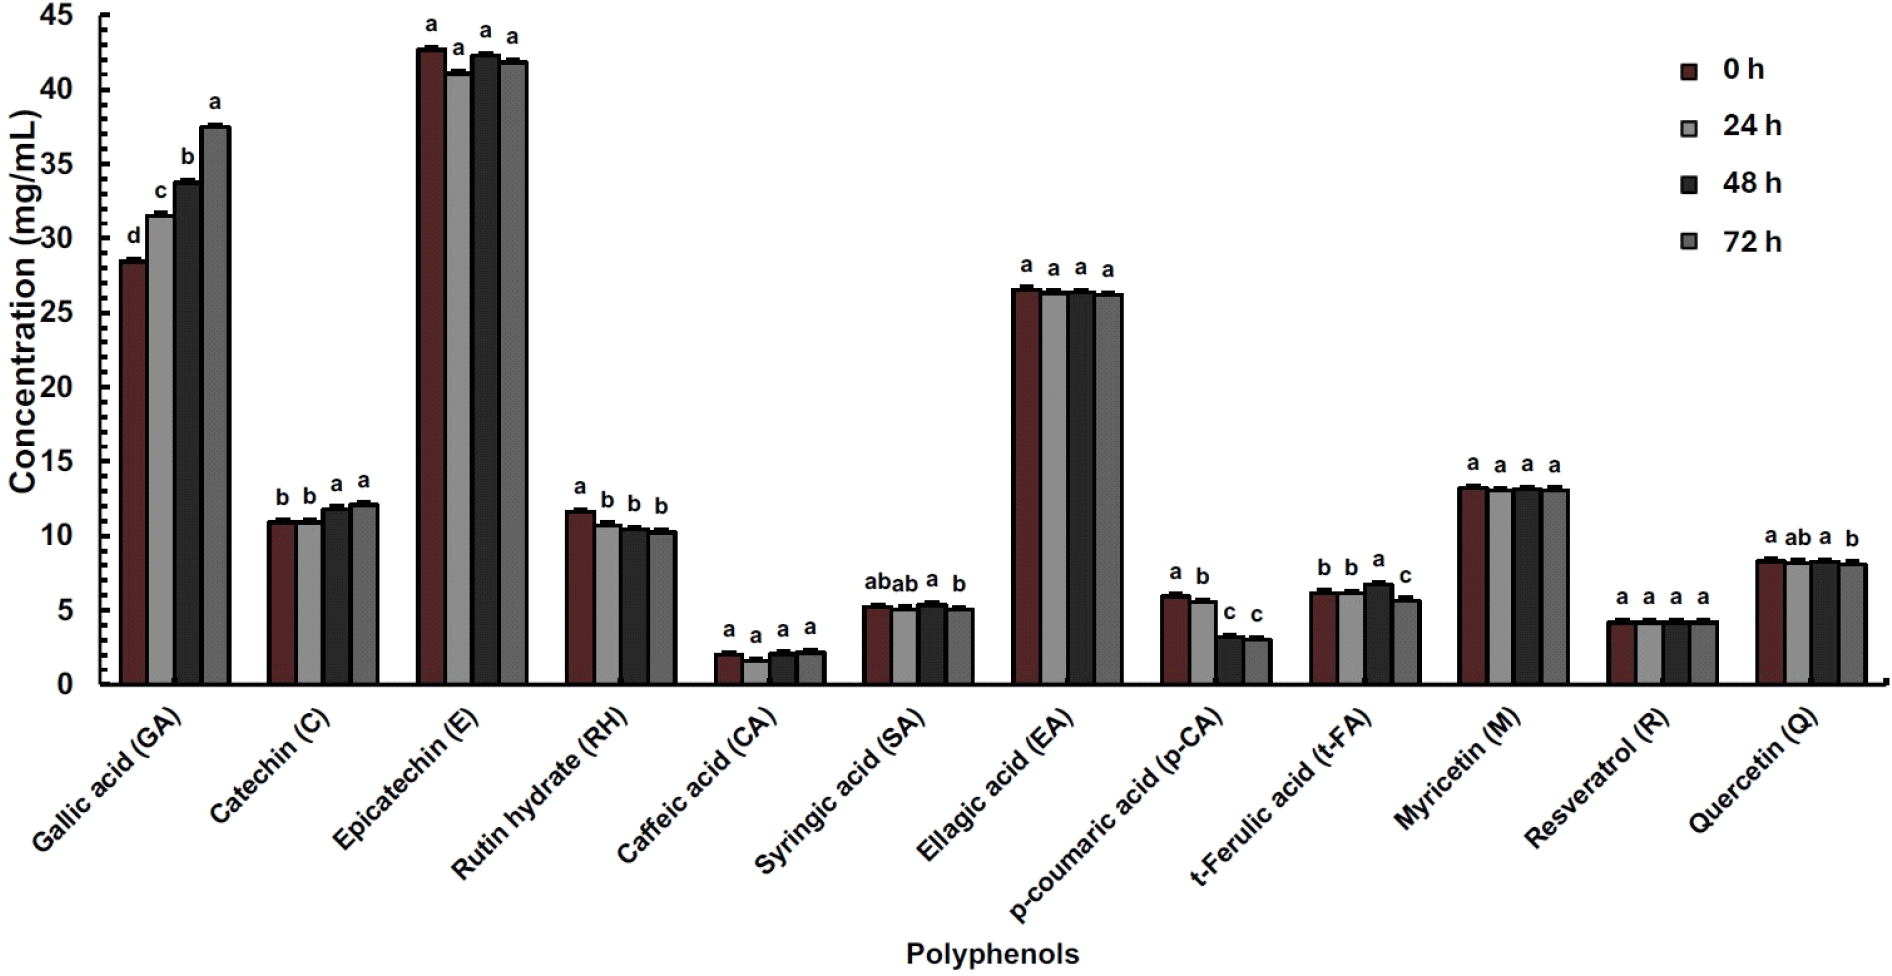
The change in the concentration of specific phenolic compounds as influenced by lactic acid fermentation was also analyzed. Fig. 3 illustrates the changes in predominant polyphenols found in horticultural crops through the fermentation of A. bunius fruit juice. Among the phenolic acids, there was a substantial increase in gallic acid, while a significant decrease was observed in rutin hydrate, p-coumaric acid, and quercetin, which started at 48 h, 24 h, and 72 h, respectively. The phenolic acids t-ferulic acid and syringic acid follow a similar trend, increasing at 48 h and decreasing at 72 h. Additionally, there was a substantial increase in the flavonoid catechin (p<0.05).
The similarity in the amount of total phenolics between the unfermented and LAB-fermented fruit juice was also previously documented (Di Cagno et al., 2011). Their lack of significant differences may imply the overall dynamic shift in the polyphenolic profile influenced by bacterial metabolism during fermentation. This includes an overall increase in total flavonoids and a reduction in total anthocyanins, phenolic acids, and flavonoids, accompanied by an elevated concentration of some phenolic acids and flavonoids. One possible bacterial mode of action is associated with anthocyanin metabolism (Palencia-Argel et al., 2022), leading to a significant decrease in total anthocyanin compared to the unfermented A. bunius fruit juice. Catabolizing of anthocyanins involves reactions such as hydrolysis, liberating gallic acid and syringic acid (de Llano et al., 2017), and the formation of co-pigmentation complexes with catechin, leading to increased amounts of some polyphenols during lactic fermentation. The result confirms that the juice sample contains high amounts of polyphenols, which is supported by existing studies on A. bunius fruit (Recuenco et al., 2016; Sartagoda et al., 2021) and concentrate (Hardinasinta et al., 2021). Probable polyphenolic reactions include the hydrolysis and demethylation (de Llano et al., 2017) of rutin hydrate to gallic acid and quercetin (China et al., 2012), p-coumaric acid to t-ferulic acid (Liao at al., 2023, and quercetin to catechin. The increased levels of polyphenolic metabolites (i.e., gallic acid, t-ferulic acid, syringic acid, catechin) can be associated with improved biological activities of the juice (Jamar et al., 2017).
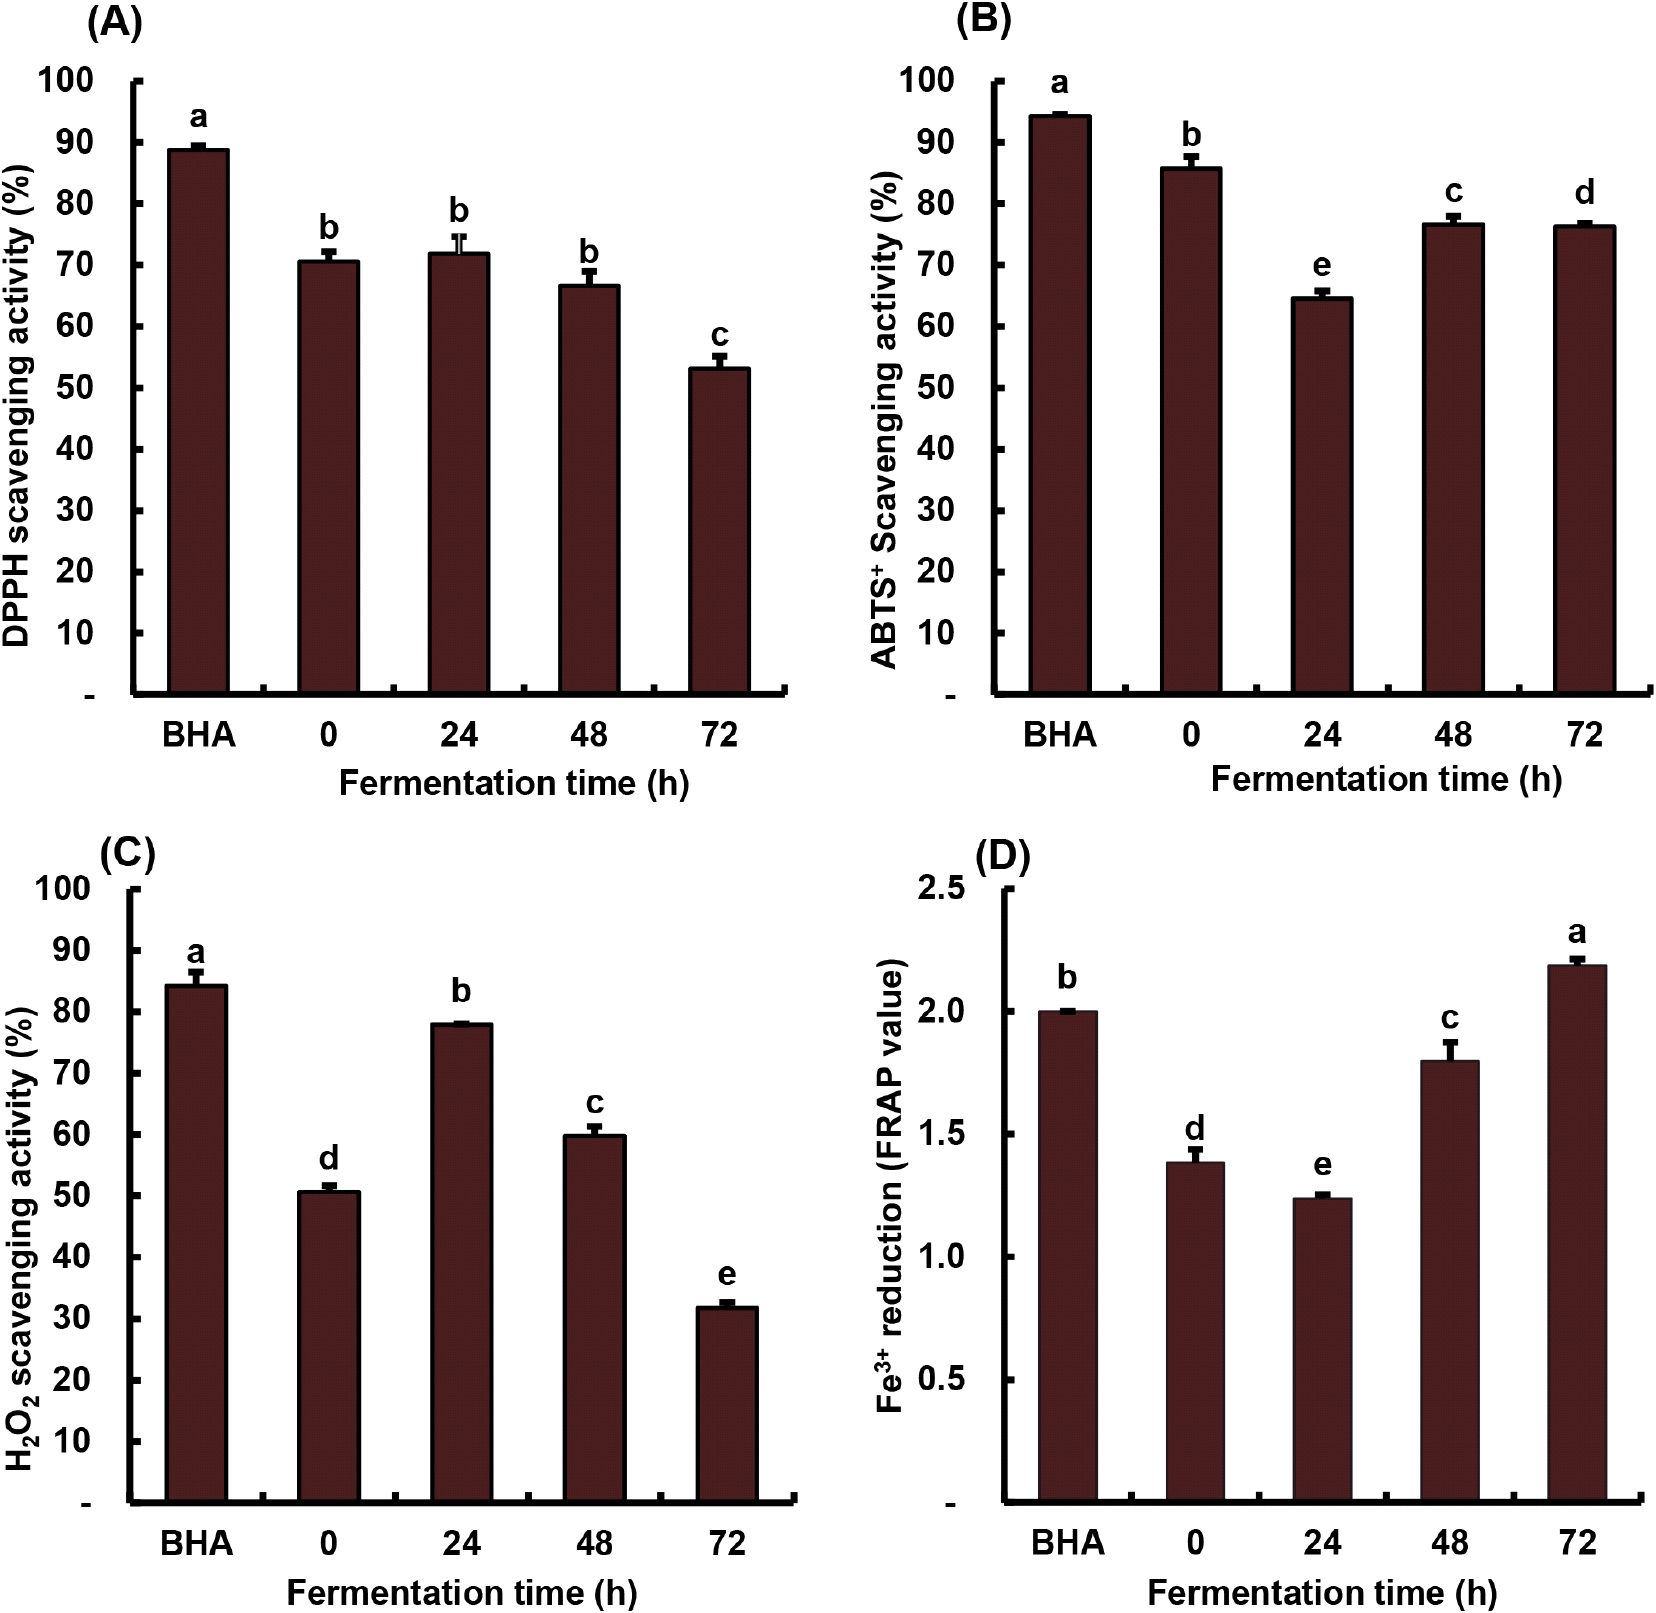
The antioxidant activities of A. bunius juice were assessed to monitor changes and demonstrate the effect of lactic acid fermentation (Fig. 4). The BHA standard, a common antioxidant used in foods, showed the highest scavenging activities (84-94%) compared to the juice samples (Fig. 4A-4C) but exhibited lower reducing power than the 72-hour fermented juice (Fig. 4D). The DPPH• scavenging activity began to decline, reaching 53% at 72 h (Fig. 4A). ABTS•+ scavenging activity fluctuated during fermentation, peaking at 48 h (77%) (Fig. 4B). H2O2 scavenging activity increased at 24 h (78%) and then started to decrease at 48 h (Fig. 4C). Meanwhile, the Fe3+ reducing power showed an initial slight decrease in the graph, followed by a continuous and notable upward trend (Fig. 4D). Several studies have established the remarkable antioxidant activity of phenolics, primarily attributed to their ability to transfer hydrogen atoms or electrons to free radicals (Wang et al., 2022).
A study by Thbayh and Fiser (2022) presented that synthetic BHA exhibited more antioxidant potential than natural polyphenols, which is consistent with the findings of this study. Similar trends were observed in the lactic acid fermentation of A. bunius fruit juice for DPPH• (Di Cagno et al., 2017), ABTS•+ (Fessard et al., 2016), and H2O2 (Wouters et al., 2013) scavenging activities, as well as Fe3+ reducing power (Yang et al., 2014) in some lactic acid fermented fruits and vegetables. In this study, ABTS•+ exhibited higher reactivity than DPPH• due to the solvent environment during the assay, radical mode of synthesis, and radical stability (Durmaz et al., 2023). Meanwhile, the decreasing DPPH• and sudden initial increase in H2O2 scavenging effect are attributed to the production of bacterial metabolites during fermentation, which can be utilized in the assay reaction. The mechanism of reducing power involves the transfer of electrons by adding Fe3+ to the antioxidant to develop Fe2+, which correlates with antioxidant capacity (Durmaz et al., 2023; Sultana et al., 2017). Juice samples with compounds that exhibit redox properties and high reducing power can serve as electron donors, preventing oxidative damage (Lizardo et al., 2020). The increase in free-form polyphenols and the generation of byproducts during lactic acid fermentation of A. bunius juice contribute to the improved antioxidant capacity for consistently enhancing health-promoting properties such as chronic diseases and obesity prevention (Zhao et al., 2021).
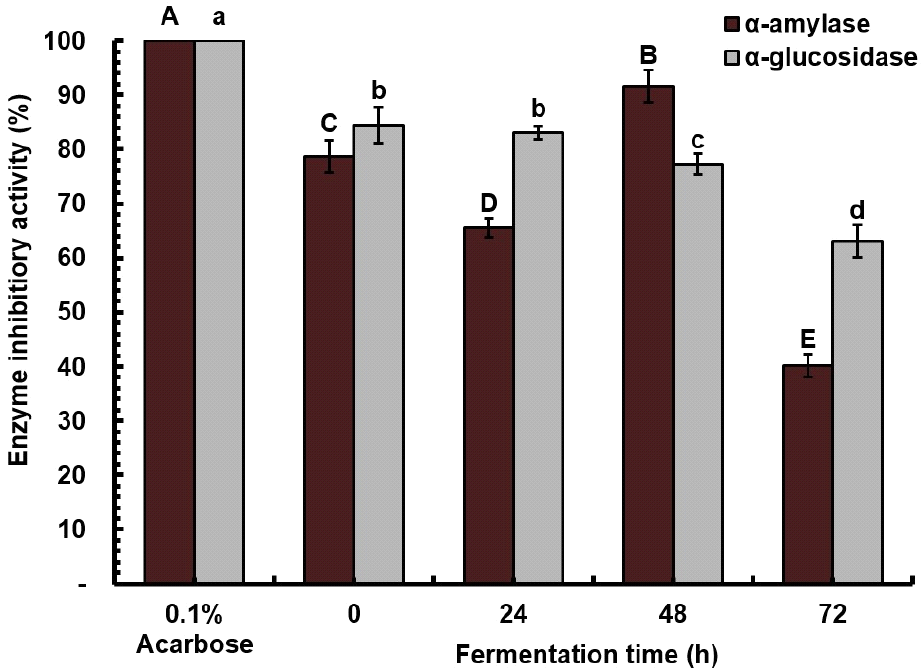
The subsequent in vitro assessment of inhibiting endogenous carbohydrases (α-amylase and α-glucosidase) was conducted to observe changes and determine the impact of fermentation on such properties of A. bunius fruit juice (Fig. 5). Concerning acarbose, which exhibited the highest activity, α-amylase inhibitory activity displayed a fluctuating trend during fermentation, reaching its peak at 48 hours (92%), surpassing the activity observed in the unfermented juice (77%). Conversely, α-glucosidase inhibitory activity decreased progressively over the fermentation period, starting at 84%, declining to 77% at 48 hours, and eventually reaching 63%. Most of the compounds correlate to antioxidant activity and show a correlation with antidiabetic activity (Razola-Díaz et al., 2023).
Acarbose, an enzyme inhibitor in diabetes treatment, is linked to adverse effects such as abdominal pain and flatulence, demanding a search for natural alternatives (Lankatillake et al., 2021). The observed in vitro α-amylase inhibition aligns with the study of Razola-Díaz et al. (2023), indicating greater potency in L. plantarum-fermented avocado seed compared to the unfermented seed, attributed to its numerous polyphenols (Razola-Díaz et al., 2023). The fermented juice exhibited potent α-glucosidase inhibitory activity, suggesting promising avenues for future research. Polyphenols, which serve as natural inhibitors for α-amylase and α-glucosidase, competitively bind to the active sites of enzymes, thereby inhibiting their activity (Wu et al., 2021). They also play a crucial role in glycemic control by enhancing insulin receptor sensitivity and improving glucose uptake by tissues (Isas et al., 2023). Furthermore, delaying the digestion of dietary carbohydrates by inhibiting carbohydrase activities reduces postprandial blood sugar levels, exhibiting antidiabetic and anti-obesity properties (Lankatillake et al., 2021).
The chemometric approach was performed to collectively analyze and maximize the information obtained from the different chemical characteristics and their relationships. During the fermentation of A. bunius fruit juice, the quality of the sample can be characterized by active polyphenols and bioactivities as depicted in the correlation matrix and PCA biplot. Positive correlations between variables during fermentation reveal that the decline in DPPH• is attributed to changes in most phenolic acids, rutin, and quercetin (Fig. 6A). Moreover, the increase in ABTS•+ is associated with decreasing anthocyanin, increasing gallic acid, and alterations in some flavonoids. The trend in H2O2 is linked to changes in p-coumaric acid, t-ferulic acid, and quercetin. At the same time, Fe3+ reduction is tied to the increasing levels of gallic acid, total flavonoids, and catechin. The increase in α-amylase is connected to the decrease in total anthocyanin, affecting t-ferulic acid, quercetin, syringic acid, and ellagic acid. Conversely, the decrease in α-glucosidase is associated with the decline in total anthocyanin, influencing p-coumaric acid, quercetin, rutin hydrate, ellagic acid, and syringic acid. Among the specific phenolic compounds, gallic acid and catechin were observed to be the most positively correlated with α-amylase, α-glucosidase, and H2O2 scavenging activity.
Multivariate analysis through principal component analysis (PCA) was done in order to characterize and explain the canonical relationships among the analyzed variables (Zielinski et al., 2018). A PCA biplot was utilized to simplify the representation of high-dimensional data during fermentation (Fig. 6B). The score plot, denoting fermentation times, revealed that the major variation could be explained by Dim1 and Dim2, with variances of 46.4% and 23.2%, respectively. The samples were grouped based on fermentation time (0, 24, 48, and 72 h). The biplot depicts the similarities and differences among these groups of samples in terms of bioactivities and the amount of specific phenolic compounds. Examination of the score plot in conjunction with the loading plot, depicting polyphenols and bioactivities, indicated close interrelatedness at 24 hours of fermentation, particularly with the decline in p-coumaric acid influenced by changes in H2O2, DPPH•, and α-glucosidase assays. Additionally, the 72-hour point exhibited increased Fe3+ reduction associated with polyphenols such as caffeic acid, catechin, resveratrol, and total flavonoids. Close interrelatedness was observed between unfermented and 48-hour fermentation concerning changes in phenolic acids, flavonoids, and total anthocyanins affected by ABTS•+ and α-amylase inhibition.
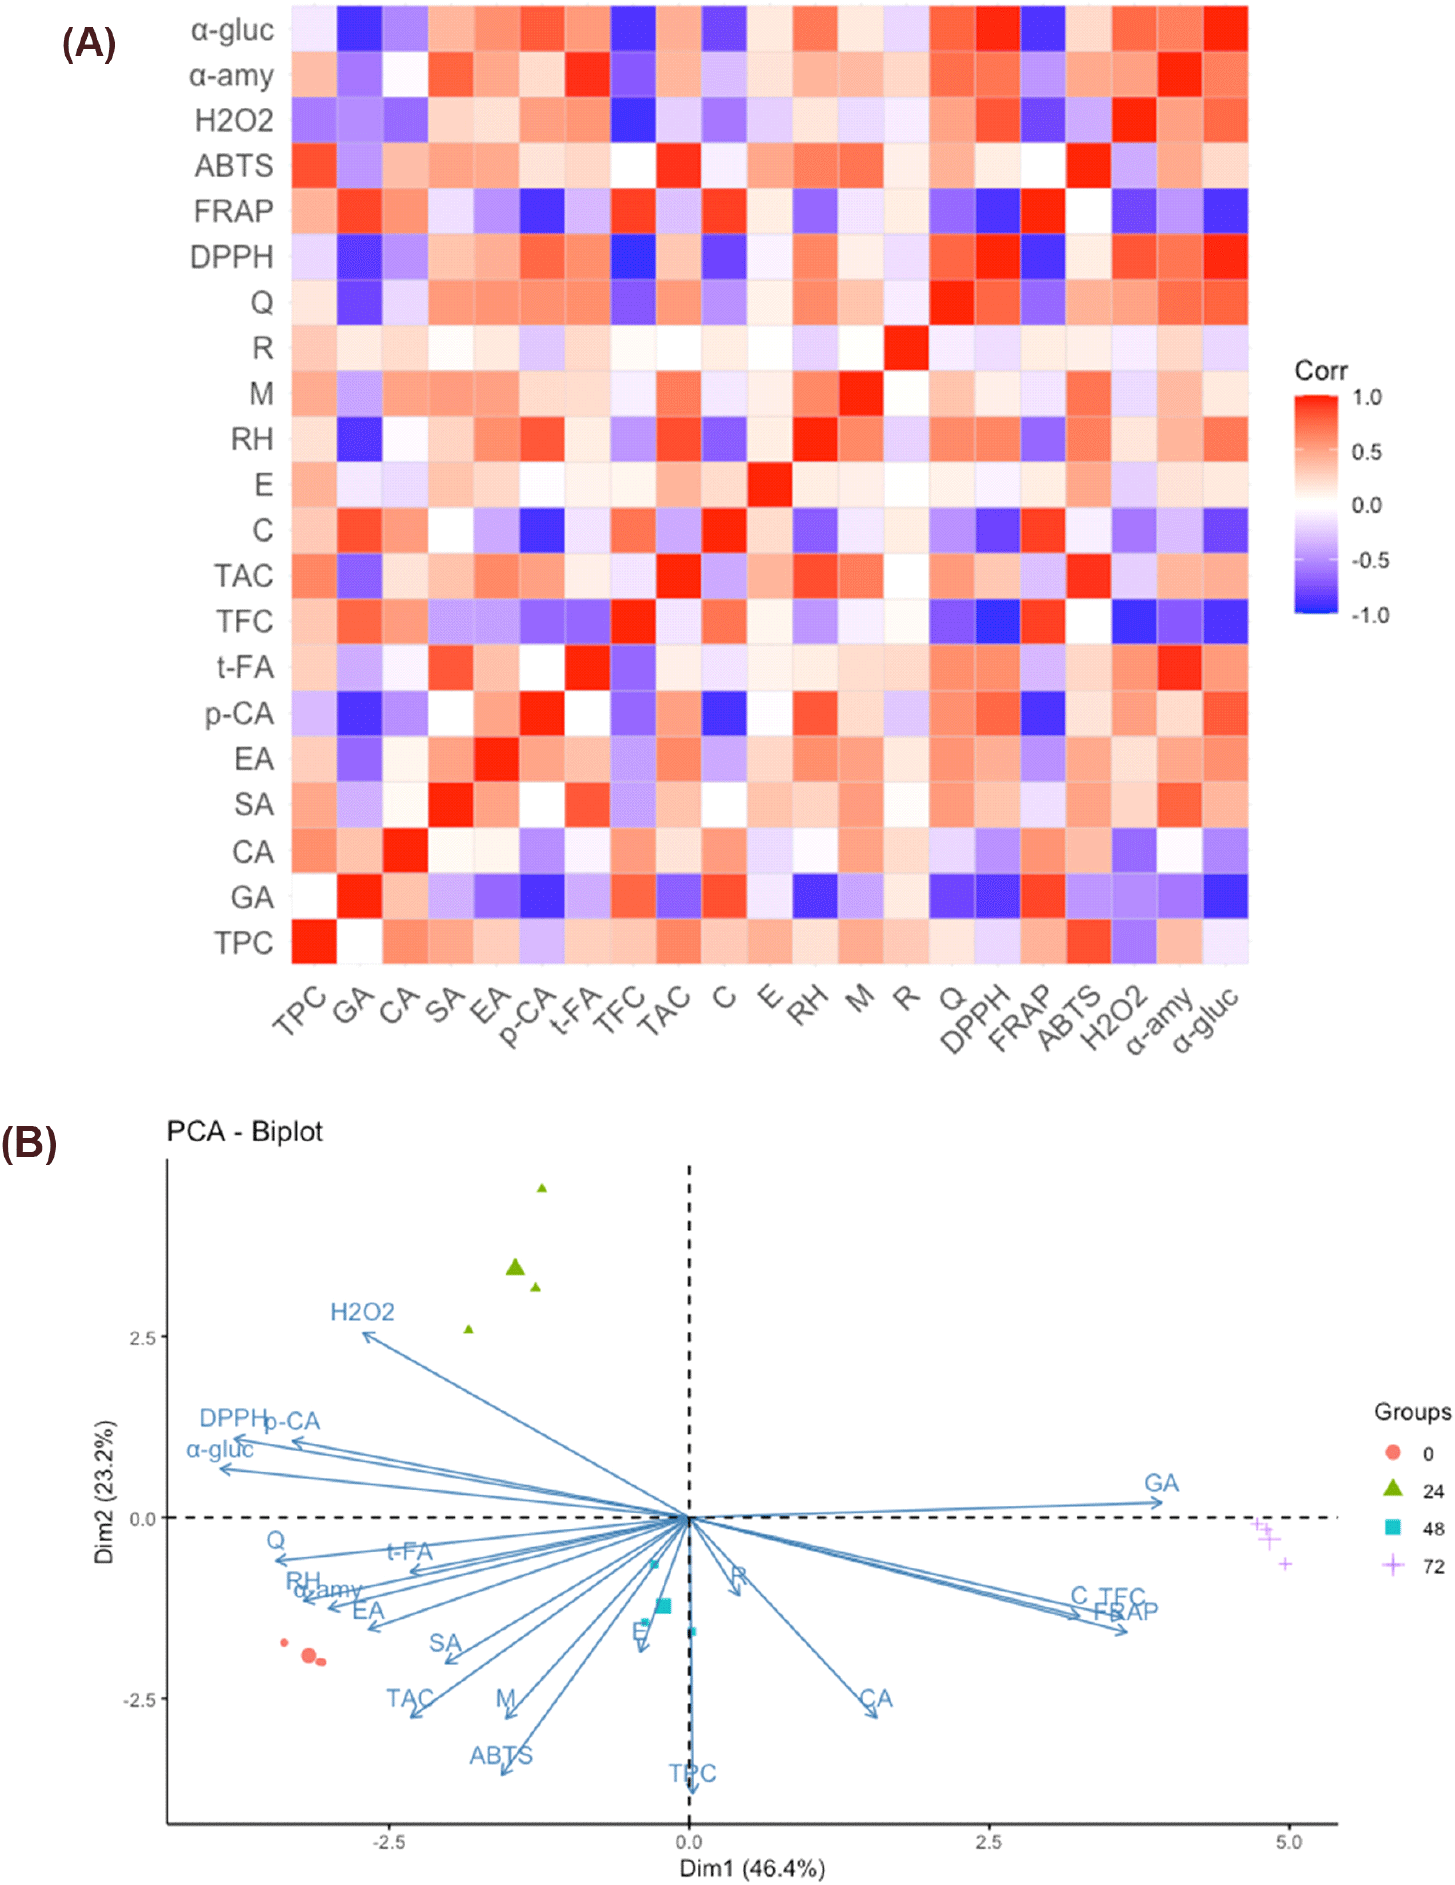
The outcomes of chemometric analyses helped in identifying the patterns and correlations among the phenolic compounds and biological activities as influenced by lactic acid fermentation with L. plantarum. In similar studies, the results of chemometric analysis have been useful in classifying unfermented and fermented beverages in terms of the evolution of both volatile and non-volatile compounds in the fruit substrates. Models from the analysis were also useful in predicting the antioxidant and other bioactivities based on the correlations (Zielinski et al., 2018). Since the process of fermentation often enhances the phenolic compound concentrations, which are known to have antioxidant and other biological activities, the results of the chemometric analysis in this study revealed that there were specific compounds in the fermented A. bunius juice that contributed the most to the desired bioactivities, optimizing the effect of the fermentation process to the functional benefits of the product (Lizardo et al., 2020).
4. Conclusions
Lactic acid fermentation of A. bunius fruit juice by L. plantarum induced dynamic changes in physicochemical properties, polyphenolic contents, and biological activities. The observed shifts in LAB count, TSS, and subsequent recovery align with literature findings, indicating the impact of juice acidity and phenolics on bacterial growth. Polyphenolic analysis revealed a complex profile shift during fermentation. Specific phenolic acids and flavonoids, such as gallic acid and catechin, increased, suggesting a positive influence on biological activities. Fermentation-induced changes positively affected the biological activities, specifically ferric reducing power and hydrogen peroxide scavenging activity, and the a-amylase enzyme-inhibition activities, revealing the potential of lactic acid fermentation to enhance the functional properties of A. bunius juice. The promising in vitro enzyme-inhibition activities against α-amylase and α-glucosidase highlight its potential as a natural alternative that can be used in the development of functional foods with anti-diabetic potential. Chemometric evaluations emphasized synergistic interactions between polyphenols, particularly gallic acid, and catechin, and bioactivities such as enzyme inhibition and H2O2 scavenging activity, contributing to the overall health-promoting properties of the fermented juice. Taken together, fermented fruit juice presents a promising method for developing a functional beverage with enhanced health benefits.


