1. Introduction
Quercetin is a flavonoid compound found in a variety of fruits, and vegetables and is widely used in the food industry and pharmaceuticals due to its antioxidant, anti-inflammatory, antitoxic, and anticancer properties (Kandemir et al., 2022). Despite its beneficial effects on human health, the practical application of quercetin as a functional food or pharmaceutical product is limited by several factors such as low solubility, instability in the gastrointestinal tract (GIT), limited bioavailability, and the hydrophobic nature of quercetin (Premathilaka et al., 2022). Therefore, in recent years, encapsulation technologies have been applied to overcome these issues by enhancing quercetin’s stability, and solubility and protecting it from environmental factors such as light, oxygen, and temperature (Fang and Bhandari, 2010).
In general, diverse encapsulation methods, including spray-drying, freeze-drying, and electro-spraying have been widely applied for quercetin encapsulation (Kandemir et al., 2022). Among the various encapsulation methods, freeze-drying encapsulation is particularly advantageous for thermolabile, oxidation-prone compounds such as quercetin, since it is conducted at low temperatures and under a vacuum, thereby minimizing degradation and preserving the compound’s bioactivity (Buljeta et al., 2022; Martinović et al., 2024). According to the previously described study by (Ballesteros et al., 2017), they compared spray-drying and freeze-drying for encapsulating flavonoids extracted from spent coffee grounds.
They reported that freeze-drying more efficiently retained bioactive compounds in encapsulated samples than spray-drying and confirmed that freeze-drying less affected the morphology of the encapsulation agent, resulting in increasing stability and encapsulation efficiency of flavonoids.
A various kind of polysaccharides are utilized as encapsulation agents of flavonoids. Among them, inulin is a natural polysaccharide found in various plants, consisting of fructose polymer linked by β-(1-2)-D-fructofuran, and the length of the fructose chain (Lu et al., 2019), is often used as an encapsulating agent due to its biocompatibility, nutritional and prebiotic properties (Afinjuomo et al., 2021). The β (2, 1) bonds in the inulin’s structure are resistant to digestion in the upper portion of the human gastrointestinal tract (GIT), allowing it to pass into the lower GIT and be partially or completely metabolized by gut microbes into lactic acid, acetate, propionate, hydrogen, and carbon dioxide (Giri et al., 2021). However, despite these benefits, the hydrophilic nature of inulin may limit its application for the encapsulation of hydrophobic compounds (Poulain et al., 2003). This limitation can be overcome by chemical modification of inulin structure by the introduction of hydrophobic functional groups in place of the hydroxyl groups, such as acetylation. The acetylation of inulin can improve physical and chemical properties, making it more effective in encapsulating hydrophobic compounds, thereby enhancing the stability and bioavailability of the encapsulated compound (Walz et al., 2018). However, there is a limited comparative analysis of the encapsulation properties of quercetin between inulin and acetylated inulin via freeze-drying, such as encapsulation efficiency, release kinetic and mechanism.
Therefore, this study aims to compare the influence of the encapsulation of quercetin using inulin and acetylated inulin as carriers through freeze-drying, their loading capacity, encapsulation efficiency, and release behavior of quercetin for effective delivery systems for functional foods and nutraceuticals.
2. Materials and methods
Organic inulin powder was collected from chicory fiber (Beneo-Orafti SA, Oreye, Belgium). Pepsin from porcine gastric mucosa powder (P7125, ≥400 units/mg protein), pancreatin from porcine pancreas (P7545, 8×USP specifications), and bile extract (B8631) were purchased from Sigma-Aldrich (Santiago, Chile). Other chemical solvents used in this study were of analytical grade and were obtained from Duksan Chemicals (Ansan, Korea).
Acetylated inulin (AcIn) was prepared according to the method with minor modifications (Wu and Lee, 2000). Briefly, 5 g of Inulin was dispersed in 50 mL of N, N-dimethylformamide (DMF) and placed in a shaking water bath (Daihan Scientific Co. Ltd., Wonju, Korea) at 40°C at 150 rpm for 30 min. Subsequently, 30 mL of acetic anhydride was added dropwise to the inulin solution. The acetylation process was continued at 40°C with stirring at 150 rpm for 24 h, using 60 mg of sodium acetate as the catalyst. Following the reaction, the product was precipitated with two volumes of distilled water. The precipitate was re-dissolved in DMF and re-precipitated after the addition of two volumes of distilled water. Finally, the precipitated product was dried in a dry oven (OTEC-004-m, Ilwon Freezer, Namyangju, Korea) at 50°C until a constant weight was reached.
Encapsulation of quercetin using inulin or acetylated inulin as an encapsulation agent was prepared according to the method proposed by Ayala-Fuentes et al., (2022) with slight modification. Four hundred quercetin was added to 10 mL of 94% ethanol solution and sonicated using an ultrasonic bath (JAC-5020, KODO, Hwaseong, Korea) until the quercetin was completely dissolved. Then, the solution was mixed with the 10% of In or AcIn solution in distilled water (w/v) and stirred under magnetic stirring (Hotplate Daihan Labtech Co., LTD, Stirrer; Wonju, Korea) at 30°C for 2 h at 150 rpm. The resulting solutions were concentrated using a rotary evaporator (R-205V, BÜCHI Labortechnik AG, Flawil, Switzerland) at 45°C and frozen in an ultra-low temperature freezer for 24 h at -80°C. After that, the samples were lyophilized using a freeze-dryer (Eyela FDU-1200, Tokyo Rikakikai, Tokyo, Japan) for 48 h at -48°C and stored in a freezer at -18°C for further experiments.
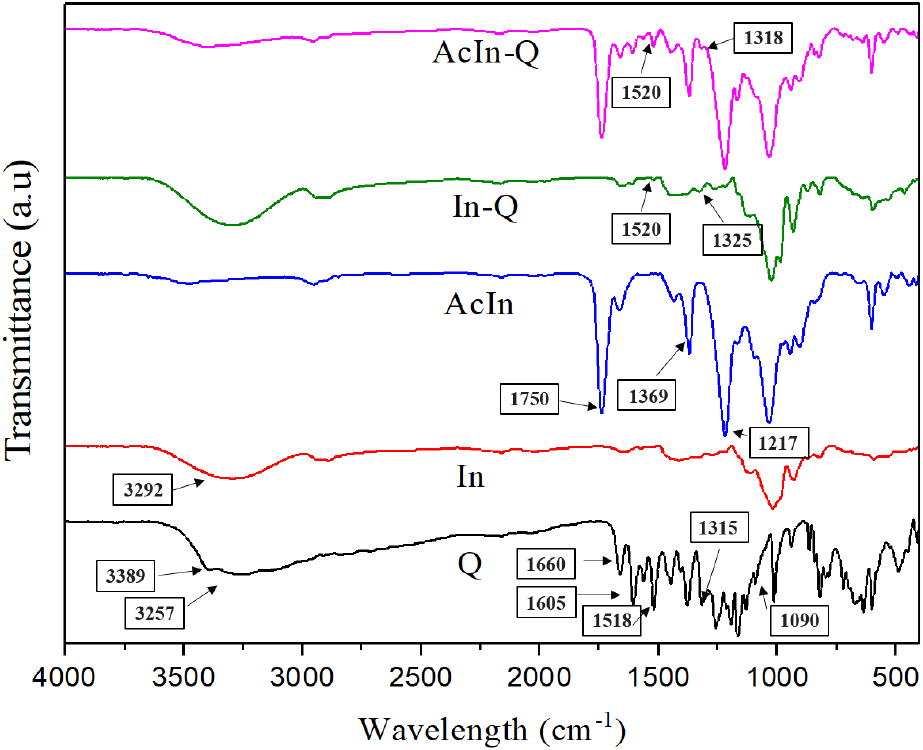
FT-IR analysis was performed on encapsulated samples (In-Q and AcIn-Q), encapsulation agents (In and AcIn), and subjects. Each sample was detected within the range of 4,000-400 cm-1 with a resolution of 4 cm-1, and 32 scans using an FTIR spectrophotometer (Frontier, PerkinElmer, Hopkinton, MA, USA).
The degree of acetylation substitution was determined according to (Peng et al., 2022). 10 mg of Ac-In was dissolved in 10 mL of 0.01M NaOH. Next, a few drops of phenolphthalein as an indicator were gradually added to the sample until a pink or red color of the mixtures appeared. Following the reaction, the solution was titrated with 0.01 M HCl solution until the color disappeared. Then, the degree of acetylation substitution was calculated as follows:
Where V0 is the volume of NaOH (mL), V1 is the volume of HCl, C0 is the concentration of NaOH, C1 is the concentration of HCl, and m is the weight of AcIn-Q (g).
Briefly, total quercetin and free quercetin solutions were prepared to investigate encapsulation efficiency (EE) and loading capacity (LC) of In and Ac-In according to the earlier reported study (Ayala-Fuentes et al., 2022).
Each sample (100 mg) of encapsulated AcIn-Q and In-Q was dispersed in 4 mL of water:ethanol:acetone (50:25:25 v/v/v) solution, vortexed for 1 min, sonicated for 20 min and after centrifuged at 4,000 rpm for 20 min. After centrifugation, the supernatant of the mixtures was recovered and measured with a UV-visible spectrophotometer (UV-2550, Shimazdu Co. Tokyo, Japan) at a wavelength of 350 nm. The quercetin content was determined using a calibration curve with (y=50.9x+0.0523, R2=0.9994).
The samples (100 mg) of AcIn-Q and In-Q were dispersed in 4 mL of methanol:water (50:50 v/v) solution, vortexed for 1 min, sonicated for 20 min, and after centrifuged at 4,000 rpm for 5 min. The supernatant was obtained by centrifugation and the quercetin content of the supernatant was also recorded as previously described.
The encapsulation efficiency and loading capacity were determined according to the equations, respectively (Quintriqueo-Cid et al., 2024):
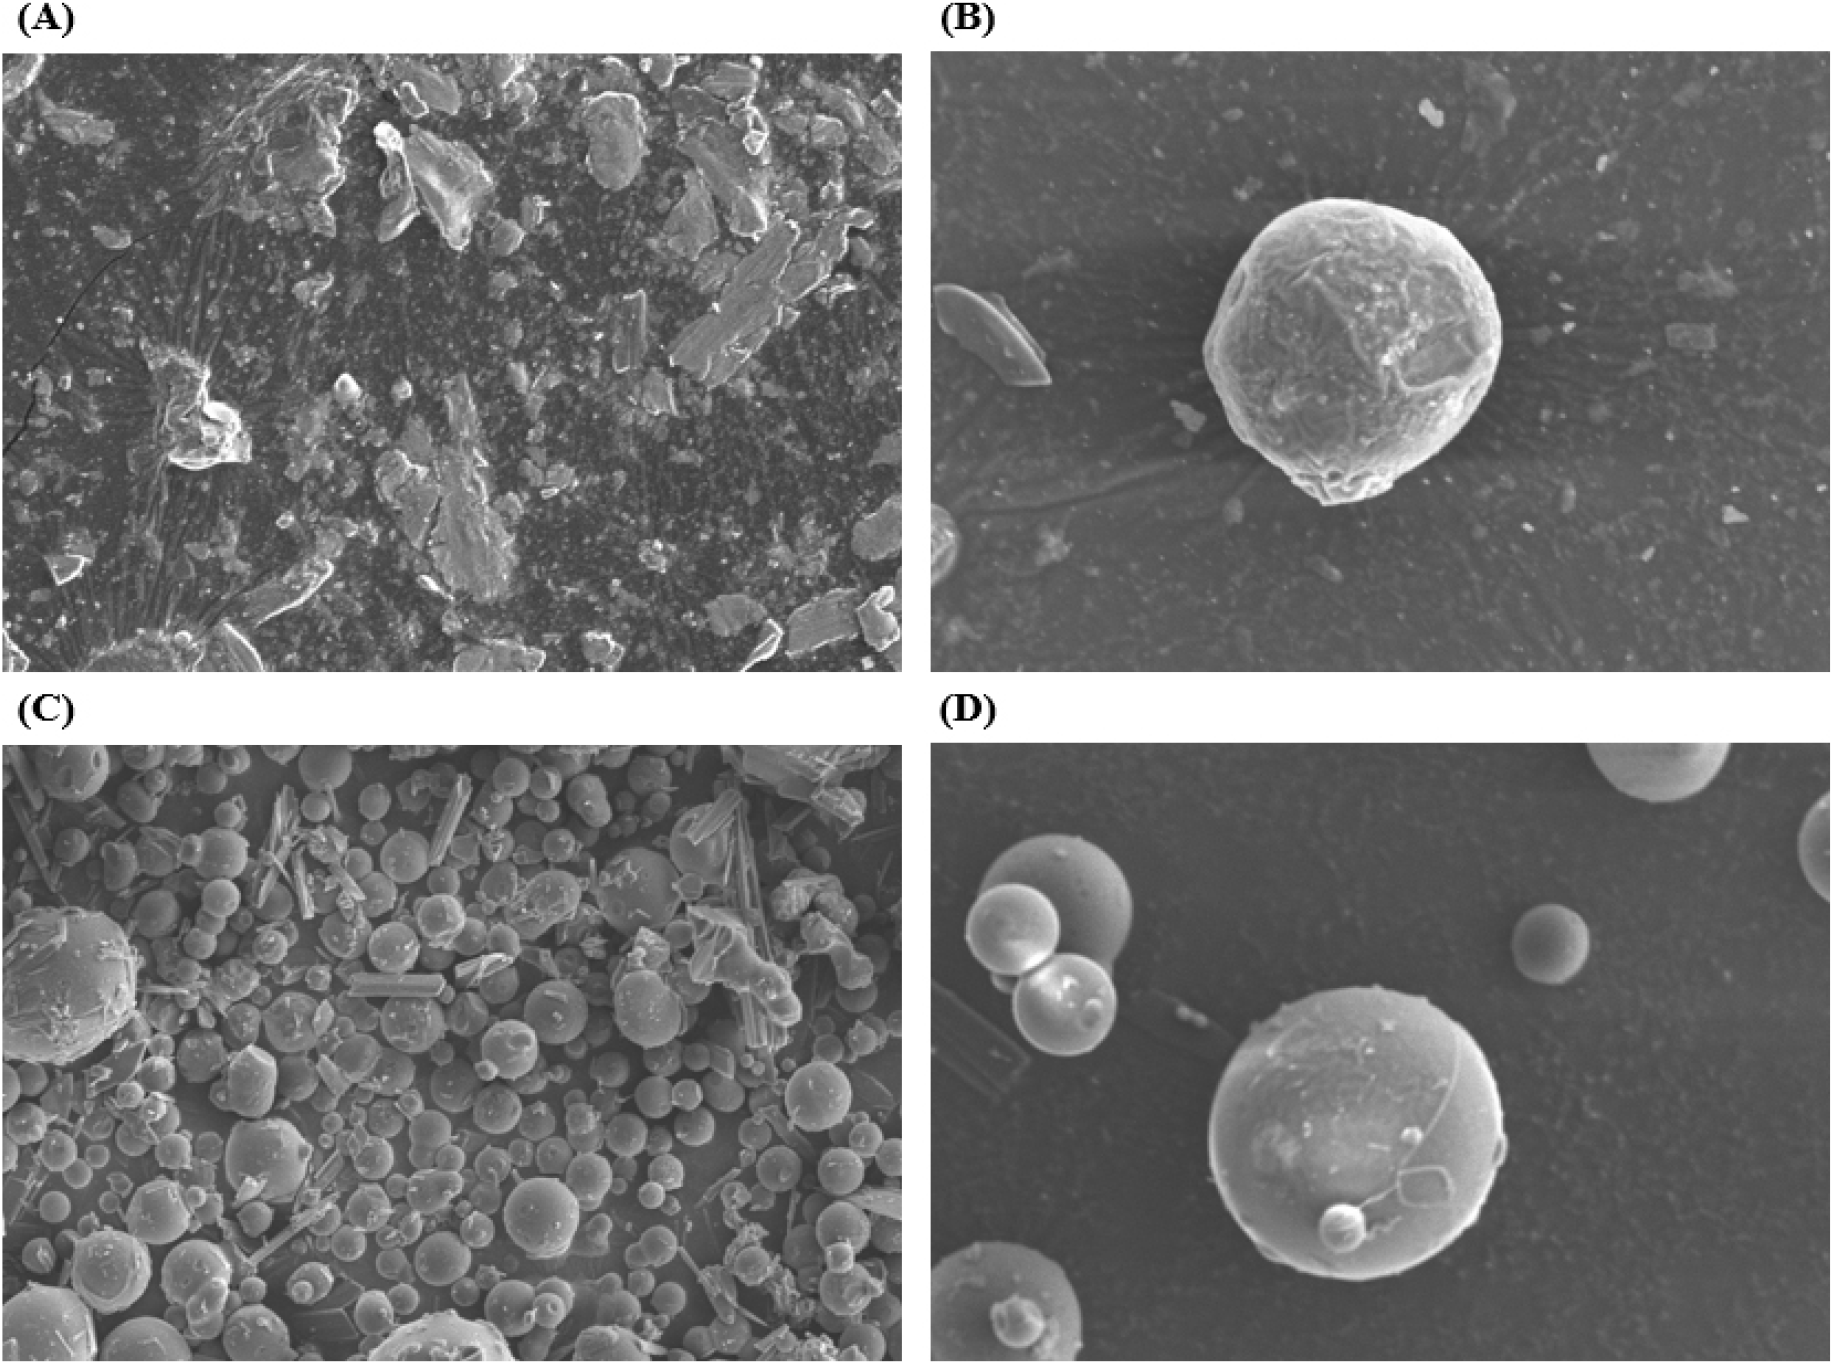
The morphology property of the encapsulated In-Q and AcIn-Q was evaluated using scanning electron microscopy (Hitachi SU8220 & SU8230, Tokyo, Japan). The samples were attached to an aluminum specimen stub and Os-coated under vacuum conditions. The coated sample was monitored at 5 kV accelerating voltage with 1,000× and 3,000× magnifications, respectively.
The release of encapsulated quercetin with inulin (In-Q) and quercetin with acetylated inulin (AcIn-Q) under simulated gastric and intestinal digestive systems was investigated following the method described by (Zou et al., 2021) with some modifications.
Each sample (600 mg) of AcIn-Q and In-Q was dispersed in 30 mL of 1M PBS solution (pH 7.0) and stirred in a water bath shaker at 100 rpm for 15 min at 37°C. After that, 30 mL of simulated gastric liquid containing 3.2 mg/mL of pepsin solution (pH 2.0) was added to the sample solution. Subsequently, the pH of the mixtures was adjusted to 2.5 using 1M HCl solution and stirred at 100 rpm for 2 h at 37°C. Every 20 min 2 mL of aliquot was taken, heated at 80°C for 5 min to inactivate the digestive enzymes, followed by centrifuged at 6,000 ×g for 20 min. The released quercetin amount in the collected supernatant according to the time was measured using a UV-visible spectrophotometer at a wavelength of 350 nm.
Following the gastric digestion phase, the pH of the mixture was adjusted to 7 with 2 N NaOH solution. Then, 3 mL of simulated intestinal fluid, containing 10 mM CaCl2, 150 mM NaCl, and 7 mL of 46.9 mg/mL bile salt solution (pH 7.0) were added, and the pH of the solution was re-adjusted to 7. The mixture was placed in a water bath shaker at 100 rpm for 2 h at 37°C to simulate the intestinal phase. Similarly, during the intestinal digestion phase, 2 mL samples were taken every 20 min, heated at 90°C for 5 min to inactivate enzymes, and centrifuged at 6,000 ×g for 20 min. The supernatant was collected and the quercetin content in the supernatant was determined as previously described.
The quercetin release in the simulated gastrointestinal was represented as a percentage of released quercetin (%) as follows;
To evaluate the release kinetic of In-Q and AcIn-Q encapsulated particles, zero-order, first-order, Higuchi, and Korsmeyer-Peppas release models were applied (Table 1), (Essifi et al., 2023; Samaha et al., 2009). The fit for each model was evaluated depending on the coefficient of determination (R2).
| Model | Equation |
|---|---|
| Zero-order | Qt = Q0 + k0t |
| First-order | Qt = Q0eK1t |
| Higuchi | |
| Kosmeyar-Peppas | Qt = kptn |
Qt, amount of the released quercetin at time t (the release time); Q0, initial quercetin content Q; whereas k0, k1, kh, and kp, release constants for the corresponding model, and n is the diffusional exponent, indicative of the encapsulated compound release mechanism, respectively.
3. Result and discussion
The analysis of FT-IR spectra was aimed at investigating molecular interactions between quercetin and the encapsulation matrixes (In and AcIn), as well as to confirm the chemical modification of acetylated inulin and the structure between the two encapsulated samples (In-Q and AcIn-Q) (Fig. 1). Primarily, the structural change between In and AcIn was examined. The blue peak, indicating acetylated inulin (AcIn), displayed new characteristic peaks at 1,750 cm-1, 1,369 cm-1, and 1,217 cm-1 compared to the red peak (In). Those observed peaks correspond to the C=O, -CH, and C-O groups, respectively. In contrast, the peak area of hydroxyl (-OH) from 3,500 cm-1 to 3,000 cm-1 was reduced in AcIn compared to the peak of In at 3,292 cm-1. This reduction in the hydroxyl peak is consistent with the findings of (Zheng et al., 2023), who observed the appearance of new peaks and a diminished hydroxyl region after acetylation. In addition, these changes confirm the successful acetylation of inulin. Secondly, the structural changes of the encapsulated quercetin by In or AcIn were additionally characterized compared to Q. The black peak (Q) showed prominent peaks at 3,389 cm-1 and 3,257 cm-1, which are attributed to the stretching vibration of the OH (hydroxyl) group, 1,660 cm-1 for ketonic carbonyl (C=O) stretching, 1,605 cm-1, 1,560 cm-1, 1,518 cm-1 for aromatic ring (C=C) stretching, 1,400-1,200 cm-1 for -OH phenolic bending, and 1090 cm-1 for aromatic (C-H) stretching (Lee and Chang, 2020; Wang et al., 2021; Wangsawangrung et al., 2022). Interestingly, for In-Q and AcIn-Q the peak intensity between 3,500 and 3,000 cm-1 was increased compared to In and AcIn alone. This result could be attributed to intermolecular interaction between Q and the hydroxyl groups of the In or AcIn matrix, which forms hydrogen bonding, resulting in increased peak areas. Moreover, the characteristic peaks for the aromatic ring stretching (C=C) remained at 1,520 cm-1 for In-Q and AcIn-Q, respectively. The characteristic peak of the phenolic bending at 1,315 cm-1 also appeared at around 1,325 cm-1 for In-Q and 1,318 cm-1 for AcIn-Q (Wang et al., 2021). This FT-IR assay concludes that Q was successfully encapsulated into the In and AcIn matrixes.

DS of AcIn were additionally determined using the titration method to conform to the structural modification of In. The degree of substitution of AcIn produced in this study was 1.8. This obtained index of DS was in line with the previous study of (Poulain et al., 2003), which also reported DS of acetylated inulin prepared similarly to section 2.4.2 was 1.8. Also depending on the amount of acetic anhydride used, another research has shown that two degrees of substitution can be achieved 1.6 and 2.1 (Robert et al., 2012). Therefore, an increased DS results in increasing the hydrophobicity of the modified inulin, which could contribute to its ability to encapsulate hydrophobic compounds like quercetin.

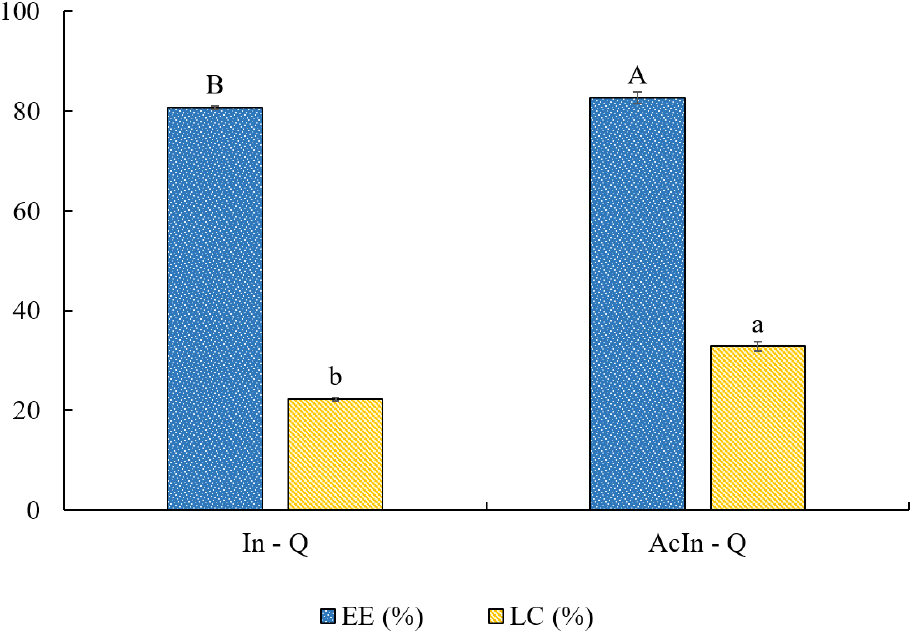
The results of the EE and LC of quercetin encapsulated with AcIn-Q and In-Q are presented in Fig. 2. The EE values for AcIn-Q and In-Q were 82.74% and 80.69%, while the LC values were 32.85% and 22.22%, respectively (p<0.05). Notably, the EE and LC values for AcIn-Q are higher than the earlier reported for the encapsulation of quercetin by spray drying using encapsulant agents such as caseinate/kappa-carrageenan coating around zein nanoparticles and quinoa starch (Ayala-Fuentes et al., 2022; Jiang et al., 2022; Zou et al., 2021). It is worth noting that the AcIn-Q encapsulate presented higher EE and LC values compared to the In-Q. Modifying the chemical structure of inulin by introducing of hydrophobic group can enhance the EE and LC, which might be attributed to the increase in oxygen atoms in the acetylated inulin, which allows for more interactions with quercetin molecules than native inulin through hydrogen bonding, similar to what has been observed with acetylated starch (Acevedo-Guevara et al., 2018). This phenomenon could be also supported by the analysis of FT- analysis discussed in Section 3.1.1, where the observed increase intensity at the 3,500-3,000 cm-1 range for AcIn-Q suggests enhanced hydrogen bonding. Consequently, this enhanced molecular interaction between the acetylated inulin matrix and quercetin led to improved EE and LC.
The effect of the different encapsulate agents on the morphology of encapsulated Q through the freeze-drying process was investigated using scanning electron microscopy (SEM), and the resulting images are presented in Fig. 3. Encapsulation with native inulin (Fig. 3A and 3B) showed irregular particle shapes and sizes with rough textures, which is consistent with the previous findings on freeze-dried encapsulations (Estupiñan-Amaya et al., 2020). In contrast, the encapsulation of quercetin with acetylated inulin (Fig. 3C and 3D) showed more uniform, spherical particles with consistent sizes. The surfaces of these particles appeared smoother and more consistent compared to those encapsulated with native inulin. This could be due to the enhanced hydrophobic interactions introduced by the acetyl groups in acetylated inulin, which may improve the encapsulation efficiency and stability of quercetin during the freeze-drying process. These results further support findings related to the improved encapsulation efficiency and loading capacity in section 3.1.3.

These results differ from those observed in similar studies, which applied other technologies for the encapsulation of inulin. For example, both inulin and acetylated inulin microspheres produced via a coacervation method (Poulain et al., 2003) appeared spherical and agglomerated with a very smooth and uniform surface texture. Similarly, a study employing the spray-drying method observed that the gallic acid (GA)-inulin system produced microparticles, which were more spherical and had fewer indentations on the surface than the In-Q produced in this study (Robert et al., 2012). In addition, those previous studies confirmed that the encapsulated inulin with a smooth surface and round morphology exhibited better encapsulation properties. Thus, the result of SEM suggests that for producing an appropriate encapsulated inulin under the freeze-drying method, acetylation of inulin could be a strategy.
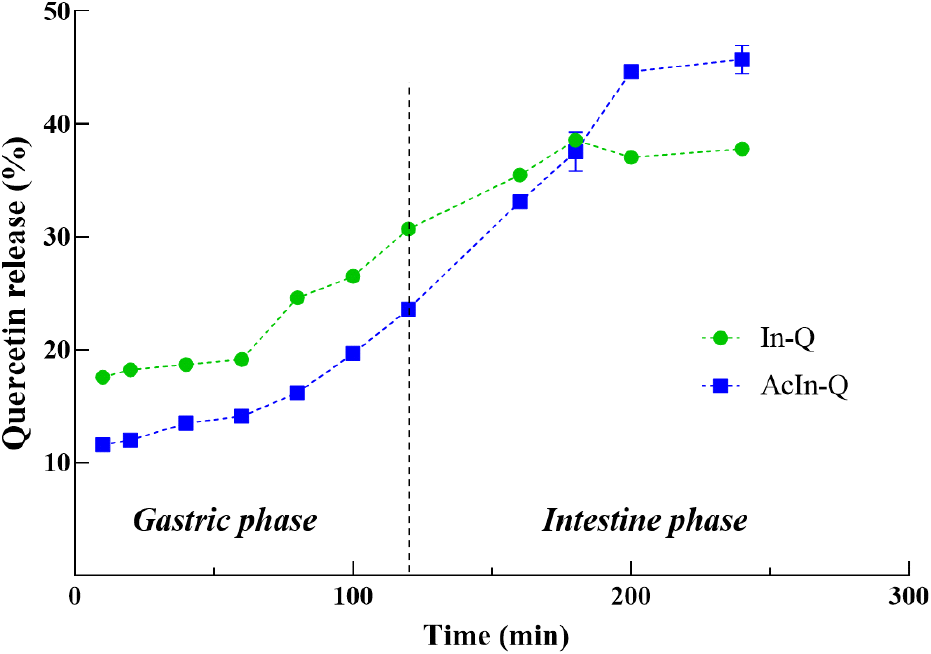
The release profile of In-Q and AcIn-Q microcapsules is shown in Fig. 4. During the gastric stage from 0 to 120 min, the release percentage of quercetin from In-Q and AcIn-Q gradually increases. Especially In-Q released a higher percentage of quercetin, reaching around 30%, compared to AcIn-Q, which released approximately 20% at the end of the gastric phase. A similar phenomenon was observed in a study by (Robert et al., 2012), where the release of gallic acid from acetylated inulin microcapsules was considerably lower compared to native inulin. This reduction in release might be attributed to the acetylation process, which decreases the hydrophilic nature of inulin, thereby reducing its solubility in water and swelling capacity. The studies of encapsulation of mesalamine with acetylated inulin microcapsules also showed a similar trend (Walz et al., 2018). The reduced hydrophilicity of acetylated inulin was found to prevent rapid particle swelling and dissolution, thus modulating the release rate.

In the intestinal stage from 120 to 240 min, In-Q showed a more rapid release of quercetin, reaching up to the maximum release of 38.59% at 180 min and showing decreasing until the end stage. On the other hand, AcIn-Q exhibited a gradually increasing release of quercetin until the last, reaching 45.72%. This result confirms that the AcIn-Q releases more quercetin in the intestinal stage than In-Q, which could contribute to increasing the opportunity for the activity of quercetin in the intestine, facilitating biological activity such as anti-inflammatory, antitoxic, and anticancer properties.
The data from the quercetin release from In-Q and AcIn-Q were evaluated by the four different mathematical models (Table 2). According to the correlation coefficients (R2), the Korsmeyer-Peppas release model with high R2 values exceeding 0.95 for both In-Q and AcIn-Q provided the most suitable model for the description of the quercetin release mechanism. In the Korsmeyer-Peppas model release exponent (n) indicates the type of the release mechanism. For In-Q, the n value was 0.37, lower than 0.45, confirming the release of quercetin from the inulin matrix by Fickian diffusion, indicating that the release is primarily controlled by diffusion. While for AcIn-Q, the n value was 0.77, reflecting non-Fickian diffusion (anomalous diffusion mechanism). This suggests that the release of quercetin from the acetylated inulin was involved by a combination of diffusion, including swelling and erosion. (Essifi et al., 2023; Porbaha et al., 2024). The discrepancy in the release mechanisms can be attributed to the structural and chemical modifications in the acetylated inulin, which may affect the interaction between the encapsulating agent and quercetin, and the diffusion pathway.
4. Conclusions
In this study, inulin was successfully modified with an acetyl group and characterized by FT-IR and DS. The SEM images demonstrated that quercetin encapsulated with acetylated inulin (AcIn) formed more uniform and spherical particles compared to those encapsulated with native inulin (In), highlighting the effect of both the encapsulant and the freeze-drying process on particle morphology and stability. The encapsulation efficiency and loading capacity of AcIn-Q were higher than those of In-Q, indicating that an increase in the hydrophobicity of inulin is more effective for encapsulating and controlling quercetin release. The release profile of quercetin showed rapid release from In-Q, whereas from AcIn-Q it showed slower and more controlled release. Kinetic analysis revealed that the Korsmeyer-Peppas model best characterizes the release behavior, with quercetin released from In-Q following Fickian diffusion and AcIn-Q by non-Fickian (anomalous) diffusion. Overall, our study shows that modifying the structure of inulin can effectively control the release profile of quercetin, enhancing its potential therapeutic efficacy through optimized encapsulation and controlled release.


