1. Introduction
The increasing demand for sugar is driving the development of various alternative sweeteners including those derived from the hydrolysis of different starch sources. Starch which is a carbohydrate commonly found in plants is abundant in nature (Harni et al., 2021). Plants rich in starch include cereals such as rice, corn, and wheat with starch content ranging from 30% to 80%, beans and soybeans containing 25% to 50%, and tubers with starch levels between 60% and 90% (Acosta-Pavas et al., 2020). Setiawan et al. (2022) further asserted that sago was part of the plants with the highest starch content, approximately 90%. Therefore, sago is a promising substrate for producing fructose syrup as an alternative to cane sugar sweeteners.
Fructose syrup is primarily a sweetener composed of a mixture of glucose and fructose (Singh et al., 2018). It is a liquid sweetener known for the high sweetness with a sweetness index of 180, compared to sucrose and glucose with levels of 100 and 74, respectively (Yulistiani et al., 2019). Additionally, fructose syrup is widely used in large-scale industries due to several advantages (Zhou et al., 2020) such as the resistance to crystallization, ease of dissolution, and approval as Generally Recognized as Safe (GRAS) (Mohammadi et al., 2019).
Production of fructose syrup generally includes several stages namely gelatinization, liquefaction using α-amylase, saccharification with amyloglucosidase, and isomerization with glucoisomerase (Gahlawat et al., 2017; Singh et al., 2018). Gelatinization occurs when starch granules swell due to heating, causing an increase in volume that breaks hydrogen bonds within starch glycoside structures (Megavitry and Nurhijrah, 2019). Liquefaction performed without initial gelatinization will take a longer time compared to substrate that has undergone gelatinization. It is the stage of starch hydrolysis to produce simpler oligosaccharides or dextrins using the α-amylase enzyme (Megavitry and Nurhijrah, 2019). Saccharification then breaks down dextrins into glucose using glucoamylase or a combination of glucoamylase and pullulanase enzymes (Megavitry and Nurhijrah, 2019). This process is optimal at temperatures of 40-60°C and a pH of 4.5-6.0 (Amaral-Fonseca et al., 2021). Finally, isomerization converts glucose into fructose through several steps: glucose ring opening, cis-enediol intermediate formation, proton transfer, and fructose ring-closing (Zhang et al., 2019).
Nury and Luthfi (2023) examined the production of fructose syrup by varying the pH during the isomerization stage, whereas Natori et al. (2022) focused on using starch suspension as a substrate. Both studies provided valuable insights into the isomerization process in fructose production. However, there is a gap that needs further exploration, specifically regarding the optimization of glucose and enzyme concentrations. Glucose is the primary substrate in the isomerization process which is converted into fructose (Sun et al., 2018). Determining the optimal substrate concentration is crucial as it directly impacts the reaction rate and the degree of product conversion (Mbira, 2024). Additionally, enzyme concentration should be optimized to ensure maximum efficiency in converting substrate to product (Achmadi, 2022). Since previous studies has not specifically addressed the optimization of these factors, further investigation into glucose as substrate and enzyme concentrations is essential to improve the efficiency of fructose syrup production from sago starch.
2. Materials and methods
Sago starch (30% w/v) from North Luwu Regency, South Sulawesi, Indonesia, was used. The pH of the starch suspension was adjusted to 6.5 using either 0.1 N HCl or 0.1 N NaOH (Merck, DE, Germany). Subsequently, 0.1% α-amylase enzyme (>250 units/g, Sigma-Aldrich, St. Louis, MO, USA) and 1% CaCl2 cofactor (4,000 ppm, Merck) were added. The starch suspension was gelatinized at 105°C for 15 min. After cooling, an additional 0.1% α-amylase was added. The suspension was further incubated at 70°C (WiseCube WIS-20R, Wertheim, Germany) for 90 min and then allowed to cool. The pH was adjusted to 4.5 using 0.1 N HCl to obtain the liquefied sample which would be proceeded to the saccharification stage.
During saccharification, 0.75 g/kg of amyloglucosidase enzyme (>10 units/mg, Sigma-Aldrich) was added while the mixture was incubated at 60°C for 72 h. After incubation, evaporation with a rotary evaporator (Heidolph, Schwabach, Germany) was carried out to reduce the water content in glucose syrup (Modified from Megavitry and Nurhijrah, 2019). The evaporation process was further carried out until glucose syrup with concentrations of 50%, 60%, 70%, and 80%(w/v) was obtained. These concentrations were treatments with symbols GS50, GS60, GS70, and GS80, respectively.
In the isomerization process, 1,000 mL of glucose substrate was adjusted to pH 8.2 with 0.2 N NaOH or HCl. Subsequently, 0.1%(w/v) glucoisomerase enzyme (Sigma-Aldrich, 100,000 units/g) was added to substrate during the first stage of determining the optimal concentration. In the second stage, samples were treated with different glucoisomerase concentrations of 0.04%, 0.07%, and 0.1%, labeled as EC0.04, EC0.07, and EC0.1, respectively. MgSO4 ․ 7H2O cofactor (0.1 g/L, Merck) was also added, and the mixture was incubated at 60°C for 120 min.
The clarifying solution was prepared by heating lead (II) oxide (PbO, Merck) in a furnace (Thermo Scientific, Waltham, MA, USA) at 600°C for 20 min, then cooling the solution in a desiccator. A mixture of 3 g lead (II) acetate [Pb(C2H3O2)2, Merck], 1 g PbO, and 7 mL distilled water (3:1:7) was homogenized using a vortex (Adj Speed W/std Vt.1.1, Los Angeles, CA, USA). 1 mL sample was also combined with 0.25 mL clarifying solution and 0.25 mL Na2CO3 (Merck) in a microcentrifuge tube and centrifuged.
Fructose standard solution was prepared with concentrations ranging from 30-90 ppm, diluted from a 100 ppm fructose stock solution. Each concentration was pipetted (0.75 mL) into a test tube, followed by the addition of 2.25 mL of 3,5-Dinitrosalicylic Acid (DNS, Merck) reagent. This DNS reagent was prepared by dissolving 1.06 g DNS, 1.98 g NaOH, and 30.6 g KNaC4H4O6 ․ 4H2O (Merck) in 141.6 mL of distilled water combined with 0.76 mL phenol (Merck) and 0.83 g Na2S2O5 (Merck). The test tube was further heated at 100°C for 5 min, then cooled to room temperature. Absorbance was also measured at a wavelength of 570 nm using a UV-VIS spectrophotometer (Shimadzu 1240, Kyoto, Japan), and a standard curve was generated.
A total of 0.75 mL of hydrolysis solution was mixed with 2.25 mL of DNS reagent, then homogenized using a vortex and subsequently heated on a hotplate (Nesco H280 Pro, Madison, WI, USA) at 100°C for 5 min. After cooling to room temperature of 25°C, the sample was transferred into a cuvette and the absorbance was measured at a wavelength of 570 nm. Fructose content was further calculated using the standard curve regression equation.
The procedure of measuring the degree of conversion included taking samples by calculating the percentage of substrate converted to product based on the ratio of initial and final concentrations.
Viscosity was measured using a rotational viscometer cylinder (Brookfield, Middleboro, MA, USA). Liquid samples were further placed in the viscometer cylinder, and the spindle was rotated at 60 rpm. The torque required to maintain this speed was measured to calculate viscosity. Spindle numbers 1, 2, 3, and 4 were used for sample concentrations of 50%, 60%, 70%, and 80%(w/v), respectively.
Each experiment was conducted in triplicate, and results were reported as mean±standard deviation (SD), with n=3. IBM SPSS (version 16.0 for Windows, SPSS Inc., Chicago, IL, USA) was also used to perform one-way ANOVA, followed by Duncan’s multiple range test for significance analysis at p<0.05. Superscript letters in the figures showed statistical significance.
3. Results and discussion
Fructose content was measured using the DNS method with a spectrophotometer. The DNS method relied on a redox reaction between the reducing sugar (fructose) and the reagent. This was where the aldehyde group of fructose was oxidized to carboxyl and the DNS was further reduced forming amino-5-nitrosalicylic acid. This reaction led to a color change from yellow to reddish orange, showing the presence of fructose (Lam et al., 2021). Higher fructose content further led to a more intense reddish-orange color which resulted in a high absorbance value. Fructose content was carried out by using a UV-VIS spectrophotometer at a wavelength of 570 nm with the equation y = 5.02x + 0.0352 (R2=0.9923).
The results showed that substrate concentrations of 50%, 60%, 70%, and 80%(w/v) produced fructose syrup of 22.96%, 25.22%, 29.00%, and 27.29%, respectively (Fig. 1). There was an increasing trend in fructose content with higher substrate concentrations. Statistical analysis showed that substrate concentration had a significant effect (p<0.05) on fructose levels. Duncan’s multiple range test showed that the substrate concentration treatment of 50%(w/v) was significantly different from 70%(w/v), but not significantly different from the 60% and 80% treatments in terms of the fructose content produced. This relationship between substrate concentration and fructose content is shown in Fig 1.
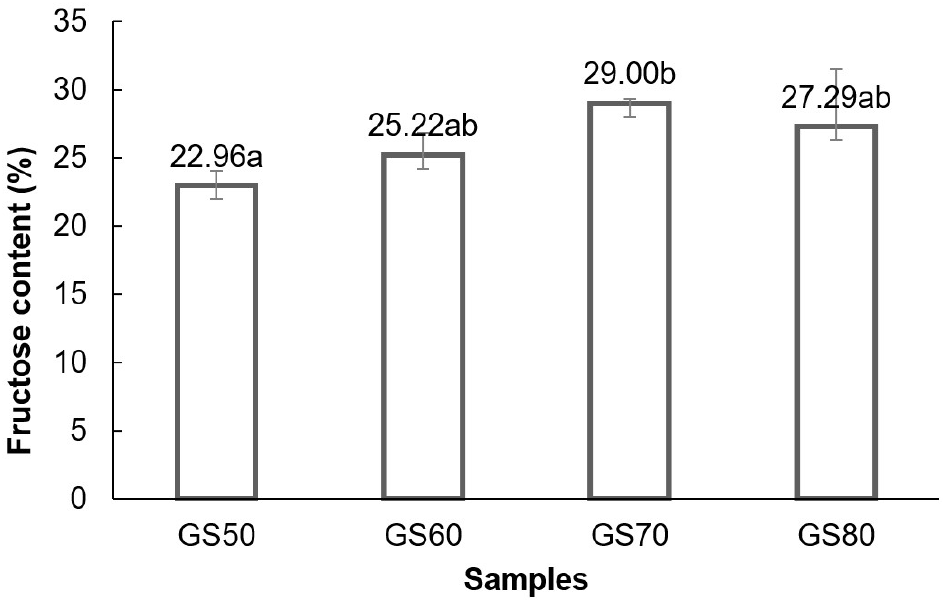
The increase in fructose levels with rising substrate concentration suggested that enzyme performance improved with more substrate available. This was because the product formed was the result of enzyme performance on substrate for high substrate allowed an increase in the product (Permanasari et al., 2018). However, at high concentrations, substrate could become an inhibitor or cause inhibition of enzyme performance which further reduced enzyme activity and effectiveness (Beltrán-prieto et al., 2018; Hernández, 2022; Kokkonen et al., 2021; Reis et al., 2023). Additionally, Butré (2014) explained that increasing substrate concentration could affect enzyme kinetics, disrupting the balance between enzyme and substrate beyond certain limits.
The degree of conversion reflected the amount of product formed per unit of substrate used, providing insight into the efficiency of production process. Substrate concentrations of 50%, 60%, 70%, and 80%(w/v) led to conversion degrees of 45.91%, 42.04%, 41.43%, and 34.11%, respectively (Fig. 2). These results showed a decreasing trend in conversion efficiency as substrate concentration increased. Statistical analysis confirmed that substrate concentration significantly affected (p<0.05) the conversion degree. Duncan’s multiple range test showed that the substrate concentration treatments of 50%, 60%, and 70%(w/v) were not significantly different from each other but were significantly different from the 80% treatment in terms of the degree of conversion achieved. The relationship between substrate concentration and conversion degree is shown in Fig 2.
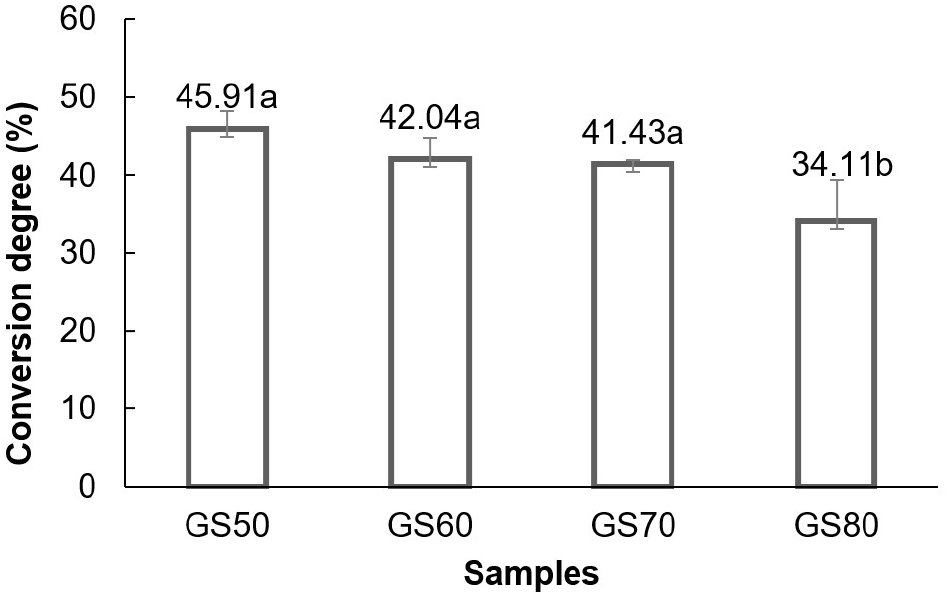
The results further showed that higher substrate concentrations led to a reduced degree of conversion. According to Kokkonen et al. (2021), enzymatic reactions at certain substrate concentrations reduced enzyme reaction rate commonly known as “substrate inhibition”. The drastic decrease at substrate concentration of 80%(w/v) reached the point of substrate inhibition, namely substrate becoming an inhibitor or inhibitor of enzyme work for the resulting product to be reduced. Reis et al. (2023) and Sahin et al. (2023) further asserted that increasing substrate concentration could slowly decrease the reaction rate. When this happened, enzyme was approaching saturation with substrate and exhibited the maximal velocity (Vmax). Additionally, Permanasari et al. (2018) and Sun et al. (2023) stated that lack of water availability or increased viscosity caused difficulties in agitation and mixing processes limiting enzyme rate and leading to products to be lower. This correlated with the viscosity results in Fig. 3 which showed an increase in viscosity along with an increase in concentration.
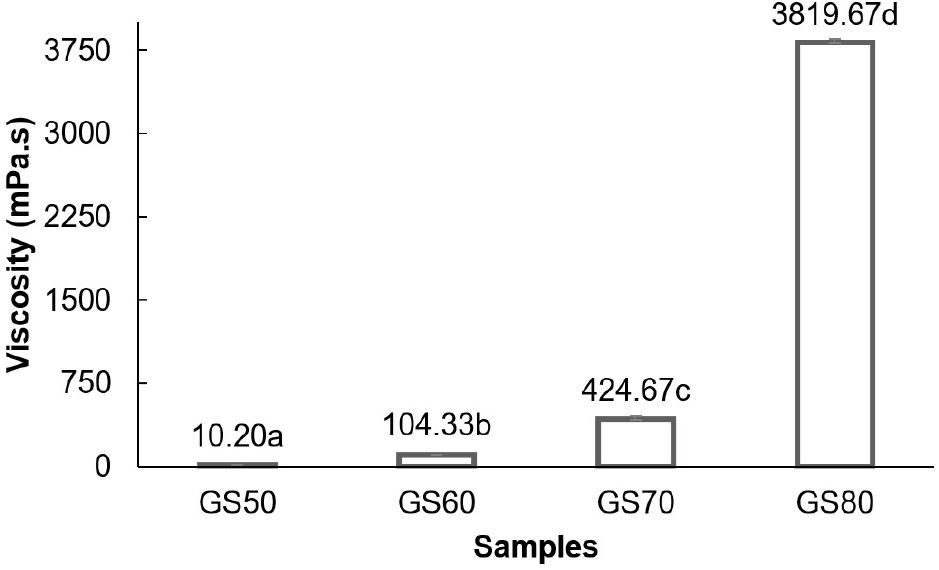
The viscosity measurements were performed using a viscometer instrument (Ramalingam et al., 2021) which assessed the resistance of fructose syrup to flow at varying shear rates. The shear rate was controlled by adjusting the rotational speed with higher speeds leading to greater resistance (Lewis, 2023). The viscosities of fructose syrup produced from substrate concentrations of 50%, 60%, 70%, and 80%(w/v) were 10.20 mPa.s, 104.33 mPa.s, 424.67 mPa.s, and 3,819.67 mPa.s, respectively (Fig. 3). A clear trend of increasing viscosity with rising substrate concentration was observed. Statistical analysis showed that substrate concentration significantly influenced (p<0.05) the viscosity of fructose syrup. Duncan’s multiple range test showed that the substrate concentration treatments of 50%, 60%, 70%, and 80%(w/v) were significantly different from each other in terms of the fructose content produced. The effect of substrate concentration on viscosity is shown in Fig 3.
The viscosities of fructose syrup solutions exhibit a wide range, significantly increasing with substrate concentration due to the higher total solids content. At lower concentrations, the viscosity remains relatively low as water molecules retain considerable mobility. However, as the concentration rises, the viscosity sharply increases. Salehi (2020) emphasizes that the content of soluble solids greatly influences viscosity, aligning with this trend. As sugar concentration increases, interactions between sugar and water molecules become denser, restricting molecular movement and raising resistance to flow (Bulavin et al., 2017). Additionally, at higher concentrations, intermolecular forces, such as hydrogen bonding between sugar and water molecules, become more pronounced, resulting in a more structured arrangement within the solution (Salehi, 2020). This restriction of molecular movement and enhancement of intermolecular interactions at elevated concentrations is further supported by Inagawa et al. (2017). Kumbár et al. (2018) also confirmed that viscosity increases proportionally with sugar concentration, further validating these results.
Fructose content was tested using a UV-VIS spectrophotometer at a wavelength of 570 nm, following the equation y = 5.02x + 0.0352 (R2=0.9923). The results showed that enzyme concentrations of 0.04%, 0.07%, and 0.1% produced fructose syrup levels of 20.67%, 23.33%, and 22.96%, respectively (Fig. 4). An increasing trend in fructose levels was observed up to a certain enzyme concentration. Statistical analysis showed that enzyme concentration significantly affected (p<0.05) fructose levels produced. Duncan’s multiple range test showed that the enzyme concentration treatment of 0.04% was significantly different from the enzyme concentration treatments of 0.07% and 0.12%, while the 0.07% and 0.12% treatments were not significantly different from each other in terms of the fructose content produced. The effect of enzyme concentration on fructose content could be observed in Fig 4.
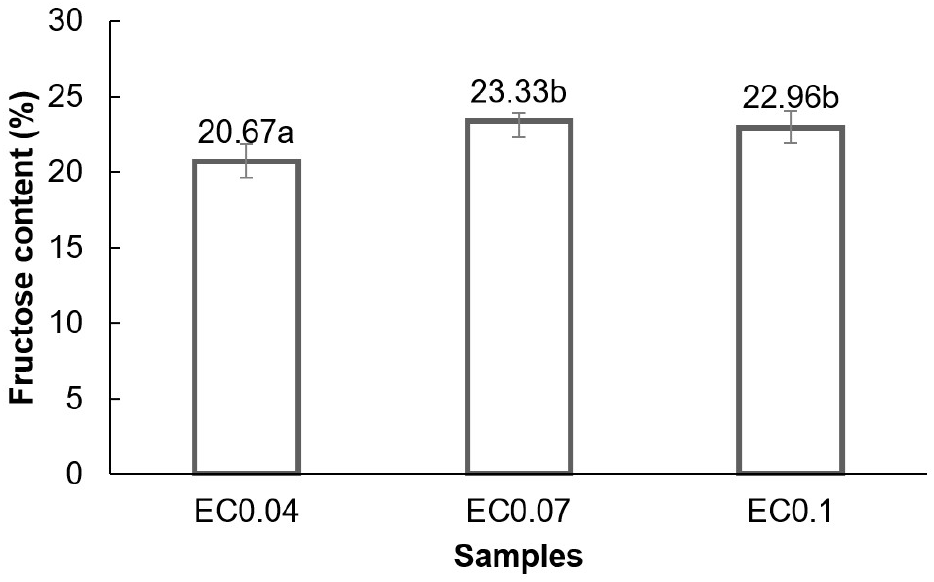
The use of 0.07% enzyme concentration increased fructose levels compared to 0.04%. However, fructose levels remained nearly constant between 0.07% and 0.1% enzyme concentration. The results suggested that enzyme concentration raised fructose levels to a threshold, after which it stabilized or even decreased. Liu (2017) explained that reaction rates increased with enzyme concentration until a saturation point was reached. Hernández (2022) and Yoo et al. (2017) added that enzyme concentration affected the reaction rate up to the saturation point. After the saturation point, the reaction speed did not increase with an increase in enzyme concentration which could be caused by an imbalance between enzyme and substrate (Straube, 2017). The presence of excess enzymes would be an inhibitor of each other because it could interfere with the active side of others that bound to the substrate. In this study, the maximum fructose content of 25% was achieved due to the use of 50% glucose as substrate and the reversible nature of the isomerization process. This was also limited by equilibrium (Marianou et al., 2018) with the maximum degree of conversion only reaching 50%.
The results showed that enzyme concentrations of 0.04%, 0.07%, and 0.1% led to conversion degrees of 41.33%, 46.67%, and 45.91%, respectively (Fig. 5). An increasing trend in the degree of conversion was observed up to a certain enzyme concentration. Statistical analysis confirmed that enzyme concentration significantly affected (p<0.05) fructose content. Duncan’s multiple range test showed that the enzyme concentration treatment of 0.04% was significantly different from the enzyme concentration treatments of 0.07% and 0.12%, while the 0.07% and 0.12% treatments were not significantly different from each other in terms of the fructose content produced. The effect of enzyme concentration on the conversion degree is shown in Fig 5.
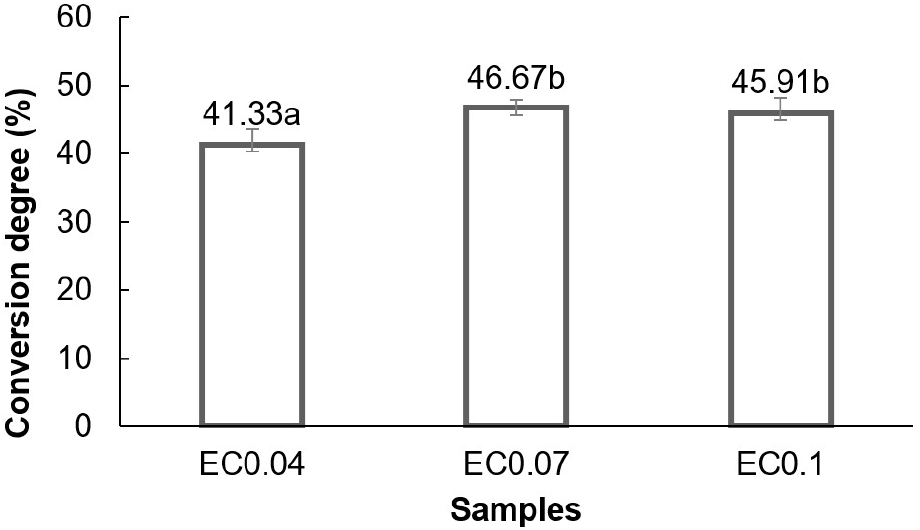
Higher enzyme concentrations led to more fructose syrup production, correlating with Baksi et al. (2023) that high enzyme concentration would increase yield. However, at enzyme concentrations of 0.07% and 0.1%, the product yield remained stable. Liu (2017) explained that reaction speed increased with enzyme concentration up to a limit. In this case, the use of 0.07% enzyme concentration in the isomerization process appeared to have reached the saturation point. Beyond this, increasing enzyme concentration did not significantly affect the degree of conversion as excesses could inhibit each other by interfering with active sites needed for substrate binding. The isomerization reaction’s reversible nature limited the maximum conversion of glucose to fructose which was constrained by equilibrium (Marianou et al., 2018), allowing a maximum degree of conversion of up to 50%. The study conducted by Fischer et al. (2022) using chemical methods with NaOH solution in the isomerization process achieved a conversion degree of 31%. The analysis further showed that the enzymatic method used in this study produced a higher conversion degree. These results suggested that the enzymatic method was more effective, specifically at an enzyme concentration of 0.07% achieving a conversion degree of 46.67% with 93% effectiveness.
4. Conclusions
In conclusion, this study has demonstrated that optimizing glucose and enzyme concentrations is essential for enhancing the efficiency of fructose syrup production from sago starch. Significant improvements in fructose yield and conversion efficiency were achieved by identifying the optimal glucose syrup concentration at 50%(w/v) and an enzyme concentration of 0.07%. These findings support the hypothesis that careful adjustment of substrate and enzyme concentrations can lead to more effective isomerization processes, ultimately maximizing fructose production. To further support the industrial application of these optimized conditions, future research should focus on evaluating the scalability and cost-effectiveness of this approach. Additionally, assessing the quality of the final product and exploring innovative technologies will be crucial for ensuring sustainable and efficient production of fructose syrup.


